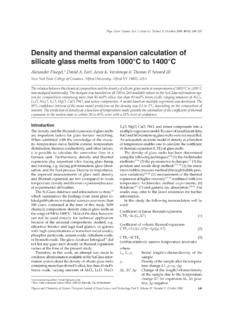
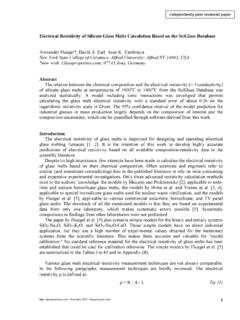
Transcription of IMPROVED COMPOSITION-PROPERTY RELATIONS …
1 AM-GOMD-25-2004. Proceedings of the 106th Annual Meeting of the American Ceramic Society, Ceramic Transactions, vol. 170, p 129-143. IMPROVED COMPOSITION-PROPERTY RELATIONS IN SILICATE GLASSES, PART I: VISCOSITY. Alexander Fluegel, Arun K. Varshneya, David A. Earl, Thomas P. Seward, Dolun Oksoy New York State College of Ceramics Alfred University 2 Pine Street Alfred, NY 14802. ABSTRACT. For the first time, several silicate glass property databases were analyzed without using any a priori knowledge of the details of bonding and lumped as a single group, as a function of the chemical composition. The viscosity of over 300 compositions including soda-lime glasses, borosilicates, glasses with high alkaline earth content, NIST glass viscosity standards, lead silicates, fluorosilicates, and phospho-silicates have been examined. Using multiple regression modeling, linear and multiplicative RELATIONS between the chemical composition and several properties, viscosity, thermal expansion, density, refractive index, electrical conductivity were developed.
2 In this paper the modeling of the viscosity versus composition is discussed. The described RELATIONS have been found to link data of different authors and compositions into one global equation which (a) allows validation of glass property datasets, (b) quantifies the influences of glass components and component interactions, and (c) allows some conclusions regarding the nature of glass. The analysis so far makes it possible to estimate the viscosity isokoms at log( /Pa s) = with an error of 7oC, at log( /Pa s) = with an error of 9oC, and at log( /Pa s) = with an error of 17oC. This research was partially funded by the US. Department of Energy, Grant DE FG 07-96EE41262. INTRODUCTION. This study was started within the framework of a larger project of the NSF. Industry/University Center for Glass Research (CGR) to provide the glass industry a database and a method for calculating the properties of technical glasses within the composition and temperature limits of interest, as pioneered in the 19th century by Winkelmann and Schott [1] and summarized recently by Priven and Mazurin [2].
3 As part of it, the viscosities of 150 industrial glass variations (including float, container, low-expansion borosilicate, TV panel, wool, and textile fiber glasses) have been determined between log( /Pa s) = 1-12 by various groups. A sta- tistical regression analysis of the results was extended to the data given by Lakatos [3], the NIST. viscosity standards SRM 710A, 711, and 717A, as well as viscosity data of Owens-Illinois Glass Company [4], and Allison & Turner [5]. Common to all sources mentioned is the observation that industrial compositions were investigated systematically, in addition to providing a chemical analysis of the glasses. EXPERIMENTAL DESIGN AND MEASUREMENT PROCEDURES. Member companies of the NSF Industry/University Center for Glass Research (CGR). selected six groups of industrial glasses for the study: float, container, low-expansion boro- silicate, TV panel, wool, and textile fiber glasses. Starting from one base composition per glass Proceedings of the 106th Annual Meeting of the American Ceramic Society, Ceramic Transactions, vol.
4 170, p 129-143. group, supplied by CGR member companies, twenty-four further composition variations per group were selected using a Plackett-Burman design based on weight percent. The concentration limits and all oxides of interest were given by CGR member representatives [6]. The glass preparation is described in [6, 7]. Viscosity measurements The viscosity curve over log( /Pa s) = 1-12 was determined by three methods: 1) Beam bending, log( /Pa s) = 10-12, by J. E. Shelby, Alfred University, Alfred, NY. 2) Parallel plate, log( /Pa s) = 6-9, by A. Fluegel and A. K. Varshneya, Alfred University 3) Cylinder rotation, log( /Pa s) ~1-2, by C. A. See et al., Pacific Northwest Laboratory (PNNL), Redland, WA [8]. The principles of the parallel-plate viscometry are described by Varshneya [9, 10], and details of this study are given in [7]. The beam bending and cylinder rotation measurement procedures, as well as all 150 analyzed glass compositions are summarized in [6].
5 The viscosity data are listed in Tables VI-VIII. Data at log( /Pa s) = for two alkali-free borosilicates with ~ 20 mol% SiO2were included in this work at log( /Pa s) = for testing the extension to wider glass composition areas in later studies. STATISTICAL DATA ANALYSIS. All concentrations in the databases were converted to mol%, from the original numbers in wt% and molar fraction. The viscosity values were fitted for each investigator separately to the Vogel-Fulcher-Tammann equation (VFT), , the three sources in [6] were not combined for enabling trend and offset analysis. The fits described the experimental data well. Following the VFT fits, for all glasses the temperatures of constant viscosities (isokom) were calculated for log( /Pa s) = , , and (~Tg). The cylinder rotation measurements done by C. A. See et al. at PNNL [6] had to be analyzed with exceptional care, firstly because the original data vary significantly in the viscosity levels examined for log( /Pa s) < , and secondly because the number of datapoints was only 2-4 for each glass.
6 If 3 or 4 datapoints were reported to cover the range around log( /Pa s) = , a VFT fit was used, else a linear fit with 2 datapoints was employed. In ~20% of all cases however the reported viscosity levels were far off from log( /Pa s) = Then, a datapoint from parallel plate measurements at log( /Pa s) = , ob- tained by Fluegel and Varshneya at Alfred University [6], was included in the VFT fit. As a re- sult, the cylinder rotation measurements done at PNNL may appear less accurate than other data. Multiple regression model type and factors A slack-variable model with variable intercept including multiplicative interactions and excluding silica was used (Eq. (1) [11]. The independent variables were the concentrations in mol% (single-component factors) and the multiplicative interactions (interaction factors); the dependent variables were the isokom temperatures in oC for log( /Pa s) = , , and No squared terms were considered because of correlations with single-component factors.)
7 N n n T(isokom) = K0 + { K1 C +. j j ( K2 C C. k j k + K3m Cj Ck Cm )} (1). j=1 k=j+1 m=j+k+1. Proceedings of the 106th Annual Meeting of the American Ceramic Society, Ceramic Transactions, vol. 170, p 129-143. K0-K3 in the model equation Eq. (1) are the coefficients, with K0 being the intercept, K1 the single-component coefficients, K2 the coefficients of two-component interaction coefficients, and K3 the coefficients of three-component interactions. The variable n in Eq. (1) is the total number of glass components (excluding silica); j, k, and m are individual numbers of the glass components, and C are the concentrations in mol%. The difference (observed calculated) value is defined as residual. The model type used in this study implies that all glasses are based on silica. In other words, all single-component and interaction coefficients in this work are in fact interaction coefficients with silica. Therefore silica-free glasses might not fit into this study.
8 Table I: Concentration limits in mol% and frequency of glass components used for the model at log( / Pa s) = ; Minimum in each range is always zero except C(SiO2)min = 20 mol%; is the standard deviation of the concentration population. Outliers were not counted. Component Maximum in mol% Average in mol% in mol% # with C > mol%. SiO2 297. B2O3 93. Al2O3 167. MgO 230. CaO 271. SrO 22. BaO 40. Li2O 27. Na2O 285. K2O 131. TiO2 23. ZrO2 14. PbO 10. ZnO 23. F 44. Fe2O3 23. Y2O3 2. CeO2 0. SO3 0. P2O5 0. Se 0. Cr2O3 0. Co3O4 0. H2O* 642* 281* 126* /. The single-component factors in this work and the concentration limits for the model at log( /Pa s) = are summarized in Table I. The models at log( /Pa s) = and have * All water concentrations listed in Table I are in ppm weight, determined by J. E. Shelby using infrared spectroscopy. The values are valid only for the 150 glasses in reference [6]. The minimum water concen- tration measured was 80 ppm weight.
9 Proceedings of the 106th Annual Meeting of the American Ceramic Society, Ceramic Transactions, vol. 170, p 129-143. similar concentration limits [12]. Neglected were minor components with C < mol%, because initial analyses proved their insignificance at these low levels: FeO, Cr2O3, Co3O4, CeO2, Sb2O3, As2O3, Se, SO3 and H2O* (Table I). All two-component interactions of the following compo- nents were considered if the interaction occurred more than twenty five times: B2O3, Al2O3, MgO, CaO, SrO, BaO, Li2O, Na2O, K2O, and F. In addition, all three-component interactions of the components B2O3, Al2O3, MgO, CaO, Na2O, and K2O were taken into account. The interaction limits, the quantitative limits of component combinations, are summarized in [12]. The interaction limits need to be considered before any calculation. Dataset-specific correction factors To the six datasets analyzed in this study (Shelby, Fluegel, See, Lakatos, Owens-Illinois, Allison), dataset specific correction factors were assigned: Trend correction: (isokom), observed = (isokom), calculated + KDT (isokom), observed (2).
10 Offset correction: (isokom), observed = (isokom), calculated + KDO (3). All dataset-specific correction coefficients KDT and KDO were set to zero in the beginning. In case the data analysis described below resulted in significant trends or offsets of the residuals vs. the observed values, either KDT or KDO per dataset were allowed to vary. KDT and KDO were never varied simultaneously for one dataset because of strong correlation. Modeling procedure Before starting the multiple regression calculation, all single-component and interaction factors were checked for linear correlations (Pearson's matrix). Strongly correlated factors with absolute correlations > were excluded from the model according to the hierarchy, the frequency of C > mol%, and the factor average over all glasses. This procedure reduced the ~90 considered variables to ~55. Multiple regression analysis was done in the programs MCA (Nextbridge Softwares, version 1999), as well as SPSS (Standard version for Windows, release , 6 Sept 2002, LEAD.)