Transcription of INCOME STATEMENT - University of Western Australia
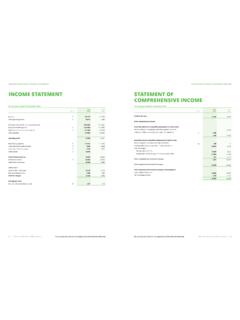
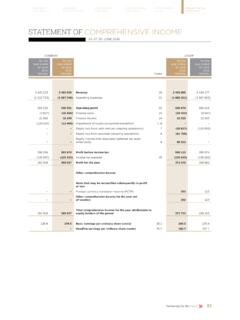
1 INCOME STATEMENT for the year ended 31 DECEMBER 2014 The above statements should be read in conjunction with the accompanying OF comprehensive INCOMEfor the year ended 31 DECEMBER 2014 ConsolidatedUniversity2014201320142013 Notes$ 000$ 000$ 000$ 000 INCOME from continuing operationsAustralian Government financial assistanceAustralian Government grants2 420,088 400,763 416,121 400,214 HELP Australian Government payments2 109,757 101,581 109,757 101,581 Western Australian and Local Government financial assistance3 50,849 49,537 49,526 49,353 HECS-HELP student payments24,656 24,933 24,656 24,933 Other research grants and contracts4 34,192 42,720 34,192 42,720 Investment revenue5 38,558 29,700 38,519 29,659 Fees and charges6 147,504 137,196 145,836 135,282 Other contributions and recoveries7 46,937 40,591 46,824 40,526 Other revenue8 76,623 103,225 75,679 95,283 Total revenue from continuing operations 949,164 930,246 941,110 919.
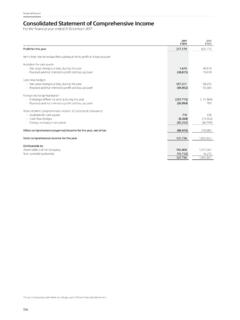
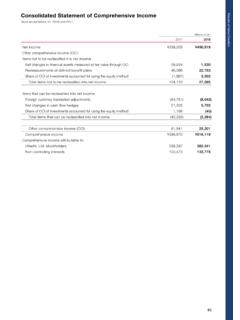
2 551 Other investment income5 209 200 209 200 Investment gains5 15,774 65,402 15,774 65,402 Total INCOME from continuing operations965,147 995,848 957,093 985,153 Expenses from continuing operationsEmployee related expenses9 552,848 530,559 545,974 523,367 Student expenses10 49,889 48,418 49,904 48,445 Materials and supplies11 32,945 35,001 29,093 31,246 Depreciation, amortisation and impairment 12 37,192 39,509 36,940 39,315 Repairs and maintenance13 15,501 19,942 15,436 19,820 Finance costs14 5,743 5,312 5,741 5,310 Grants distributed11,202 8,890 11,202 8,848 Travel 26,646 25,015 26,639 25,012 Professional fees28,338 23,832 28,318 23,804 Other expenses 15 114,246 134,531 117,694 135,209 Total expenses from continuing operations874,550 871,009 866,941 860,376 Net result attributable to members of The University of Western Australia from continuing operations90,597 124,839 90,152 124,777 ConsolidatedUniversity2014201320142013 Notes$ 000$ 000$ 000$ 000 Net result from continuing operations90,597 124,839 90.
3 152 124,777 Items that will not be reclassified to profit or lossNet Actuarial gains (losses) recognised in respect of Defined Benefit Plan29 (514)1,158 (514)1,158 Total comprehensive INCOME from continuing operations(514)1,158 (514)1,158 Total comprehensive INCOME attributable to members of The University of Western Australia from continuing operations90,083 125,997 89,638 125,935 42 | University of Western Australia | ANNUAL REPORT 2014 | 43 STATEMENT OF FINANCIAL POSITIONfor the year ended 31 DECEMBER 2014 The above statements should be read in conjunction with the accompanying notes.
4 Consolidated University2014201320142013 Notes$ 000$ 000$ 000$ 000 ASSETSC urrent assetsCash and cash equivalents18 129,927 119,957 128,240 118,315 Receivables19 38,049 40,812 37,842 41,108 Inventories20 665 567 519 436 Non-current assets classified as held for sale 21 895 -895 -Other non-financial assets22 43,561 70,490 43,544 70,477 Total current assets213,097 231,826 211,040 230,336 Non-current assetsReceivables19 89 121 89 121 Investment properties23 23,155 27,313 23,155 27,313 Other financial assets24 631,269 554,443 631,265 554,443 Other non-financial assets22 6,507 637 6,507 637 Property, plant and equipment 25 1,229,871 1,177,926 1,228,456 1,176,777 Intangible assets26 20,011 18,174 20,011 18,174 Total non-current assets1,910,902 1,778,614 1,909,483 1,777,465 Total assets2,123,999 2,010,440 2,120,523 2,007,801 LIABILITIESC urrent liabilitiesTrade and other payables28 49,649 34,045 48,298 33,011 Provisions29 94,620 88,300 94,108 88,054 Other liabilities30 44,507 41,076 44,010 40,514 Borrowings31 2,842 2,738 2.
5 842 2,738 Total current liabilities191,618 166,159 189,258 164,317 Non-current liabilitiesProvisions29 22,149 21,469 21,971 21,165 Borrowings31 125,075 127,738 125,075 127,738 Total non-current liabilities147,224 149,207 147,046 148,903 Total liabilities338,842 315,366 336,304 313,220 Net assets1,785,157 1,695,074 1,784,219 1,694,581 EQUITYR eserves32 66,602 78,891 66,602 78,891 Retained earnings33 1,718,555 1,616,183 1,717,617 1,615,690 Total equity1,785,157 1,695,074 1,784,219 1,694,581 44 | OF CHANGES IN EQUITYfor the year ended 31 DECEMBER 2014 ReservesRetained earningsTotal$ 000$ 000$ 000 ConsolidatedBalance at 1 January 2013161,976 1,407,101 1,569,077 Net operating result-124,839 124,839 Remeasurement of Defined Benefit Plan-1,158 1,158 Transfer to/(from) reserves(83,085)83,085 -Balance at 31 December 201378,891 1,616,183 1,695,074 Balance at 1 January 201478,891 1,616,183 1,695,074 Net operating result-90,597 90,597 Remeasurement of Defined Benefit Plan-(514)(514)Transfer to/(from)
6 Reserves(12,289)12,289 -Balance at 31 December 201466,602 1,718,555 1,785,157 University Balance at 1 January 2013161,976 1,406,670 1,568,646 Net operating result-124,777 124,777 Remeasurement of Defined Benefit Plan-1,158 1,158 Transfer to/(from) reserves(83,085)83,085 -Balance at 31 December 201378,891 1,615,690 1,694,581 Balance at 1 January 201478,891 1,615,690 1,694,581 Net operating result-90,152 90,152 Remeasurement of Defined Benefit Plan-(514)(514)Transfer to/(from) reserves(12,289)12,289 -Balance at 31 December 201466,602 1,717,617 1,784,219 The above statements should be read in conjunction with the accompanying University of Western Australia | ANNUAL REPORT 2014 | 45 STATEMENT OF CASH FLOWSfor the year ended 31 DECEMBER 2014 The above statements should be read in conjunction with the accompanying $ 000$ 000$ 000$ 000 Cash flows from operating activitiesAustralian Government Grants received2(h)497,456 498,431 497,456 497,882 OS-HELP (net)1,005 (8)1,005 (8)
7 Western Australian Government Grants received46,898 50,464 46,898 50,281 Local Government Grants received142 134 142 134 HECS-HELP student payments24,656 24,933 24,656 24,933 Receipts from student fees and other customers348,278 334,474 340,790 321,395 Dividends received148 197 148 197 Interest received5,373 5,982 5,334 5,982 Interest and other borrowing costs paid(5,605)(5,028)(5,605)(5,028)Payments to suppliers and employees (inclusive of goods and services tax)(808,482)(827,984)(801,519)(815,145) Net cash provided by/(used in) operating activities41 109,869 81,595 109,305 80,623 Cash flows from investing activitiesProceeds from sale of property, plant and equipment 811 586 811 586 Payments for property, plant and equipment(70,917)(111,921)(70,399)(111,2 98)Proceeds from sale of financial assets2,907 8,984 2,907 8,984 Payments for financial assets(30,000)-(30,000)-Net cash provided by/(used in) investing activities(97,199)(102,351)(96,681)(101, 728)
8 Cash flows from financing activitiesProceeds from borrowings-19,325 -19,275 Repayments of borrowings(2,716)(9)(2,716)-Net cash provided by/(used in) financing activities(2,716)19,316 (2,716)19,275 Net increase/(decrease) in cash and cash equivalents9,954 (1,440)9,909 (1,830)Cash and cash equivalents at beginning of year119,957 121,397 118,315 120,145 Effects of exchange rate changes on cash and cash equivalents16 -16 -Cash and cash equivalents at end of year18 129,927 119,957 128,240 118,315 46 | TO THE FINANCIAL STATEMENTSfor the year ended 31 DECEMBER 2014 Contents of the notes to the financial statements Note1.
9 Summary of significant accounting policies ..47 Income2. Australian Government financial assistance including HECS-HELP and other Australian Government loan programs ..543. Western Australian and Local Government financial assistance ..554. Other research grants and contracts ..555. Investment revenue and INCOME ..566. Fees and charges ..567. Other contributions and recoveries ..568. Other revenue ..56 Expenses9. Employee related expenses ..5710. Student expenses ..5711. Materials and supplies ..5712. Deprec