Transcription of India - United Nations Development Programme
1 1 Human Development Report 2020 The Next Frontier: Human Development and the Anthropocene Briefing note for countries on the 2020 Human Development Report India Introduction This year marks the 30th Anniversary of the first Human Development Report and of the introduction of the Human Development Index (HDI). The HDI was published to steer discussions about Development progress away from GPD towards a measure that genuinely counts for people s lives. Introduced by the Human Development Report Office (HDRO) thirty years ago to provide a simple measure of human progress built around people s freedoms to live the lives they want to - the HDI has gained popularity with its simple yet comprehensive formula that assesses a population s average longevity, education, and income. Over the years, however, there has been a growing interest in providing a more comprehensive set of measurements that capture other critical dimensions of human Development .
2 To respond to this call, new measures of aspects of human Development were introduced to complement the HDI and capture some of the missing dimensions of Development such as poverty, inequality and gender gaps. Since 2010, HDRO has published the Inequality-adjusted HDI, which adjusts a nation s HDI value for inequality within each of its components (life expectancy, education and income) and the Multidimensional Poverty Index that measures people s deprivations directly. Similarly, HDRO s efforts to measure gender inequalities began in the 1995 Human Development Report on gender, and recent reports have included two indices on gender, one accounting for differences between men and women in the HDI dimensions, the other a composite of inequalities in empowerment and well-being. This briefing note is organized into six sections. The first section presents information on the country coverage and methodology for the 2020 Human Development Report.
3 The next five sections provide information about key composite indices of human Development : the HDI, the Inequality-adjusted Human Development Index (IHDI), the Gender Development Index (GDI), the Gender Inequality Index (GII), and the Multidimensional Poverty Index (MPI). The tables presented in this note depict the state of human Development before the COVID-19 pandemic based on available data for 2019 and earlier years. Data reflecting changes caused by the COVID-19 pandemic and its socioeconomic fallout in 2020 will be available in 2021 and will be presented in tables and related analyses of the 2021 Human Development Report. It is important to note that national and international data can differ because international agencies standardize national data to allow comparability across countries and in some cases may not have access to the most recent national data.
4 2 1- country coverage and the methodology of the 2020 Human Development Report The 2020 Human Development Report presents the 2019 HDI (values and ranks) for 189 countries and UN-recognized territories, along with the IHDI for 152 countries, the GDI for 167 countries, the GII for 162 countries, and the MPI for 107 It is misleading to compare values and rankings with those of previously published reports, because of revisions and updates of the underlying data and adjustments to goalposts. Readers are advised to assess progress in HDI values by referring to Table 2 ( Human Development Index Trends ) in the 2020 Human Development Report. Table 2 is based on consistent indicators, methodology and time-series data and, thus, shows real changes in values and ranks over time, reflecting the actual progress countries have made.
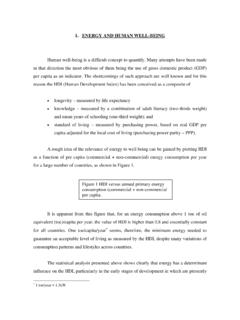
5 Small changes in values should be interpreted with caution as they may not be statistically significant due to sampling variation. Generally speaking, changes at the level of the third decimal place in any of the composite indices are considered insignificant. Unless otherwise specified in the source, tables use data available to HDRO as of 15 July 2020. All indices and indicators, along with technical notes on the calculation of composite indices, and additional source information are available online at For further details on how each index is calculated please refer to Technical Notes 1-6 and the associated background papers available on the Human Development Report website: 2- Human Development Index (HDI) The HDI is a summary measure for assessing long-term progress in three basic dimensions of human Development : a long and healthy life, access to knowledge and a decent standard of living.
6 A long and healthy life is measured by life expectancy. Knowledge level is measured by mean years of schooling among the adult population, which is the average number of years of schooling received in a life-time by people aged 25 years and older; and access to learning and knowledge by expected years of schooling for children of school-entry age, which is the total number of years of schooling a child of school-entry age can expect to receive if prevailing patterns of age-specific enrolment rates stay the same throughout the child's life. Standard of living is measured by Gross National Income (GNI) per capita expressed in constant 2017 international dollars converted using purchasing power parity (PPP) conversion rates. For more details see Technical Note 1. To ensure as much cross- country comparability as possible, the HDI is based primarily on international data from the United Nations Population Division (the life expectancy data), the United Nations Educational, Scientific and Cultural Organization Institute for Statistics (the mean years of schooling and expected years of schooling data) and the World Bank (the GNI per capita data).
7 As stated in the introduction, the HDI values and ranks in this year s report are not comparable to those in past reports because of some revisions to the component indicators. To allow for assessment of progress in HDIs, the 2020 Human Development Report includes recalculated HDIs from 1990 to 2019 using consistent series of data. India s HDI value and rank India s HDI value for 2019 is which put the country in the medium human Development category positioning it at 131 out of 189 countries and territories. Between 1990 and 2019, India s HDI value increased from to , an increase of percent. Table A reviews India s progress in each of the HDI indicators. Between 1990 and 2019, India s life expectancy at birth increased by years, mean years of schooling increased by years and expected years of schooling increased by years.
8 India s GNI per capita increased by about percent between 1990 and 2019. 1 Throughout this note, the term country refers to countries or UN-recognized territories. 3 Table A: India s HDI trends based on consistent time series data and new goalposts Life expectancy at birth Expected years of schooling Mean years of schooling GNI per capita (2017 PPP$) HDI value 1990 1,787 1995 2,078 2000 2,548 2005 3,217 2010 4,182 2015 5,391 2016 5,722 2017 6,119 2018 6,427 2019 6,681 Figure 1 below shows the contribution of each component index to India s HDI since 1990. Figure 1: Trends in India s HDI component indices 1990-2019 Assessing progress relative to other countries Human Development progress, as measured by the HDI, is useful for comparison between two or more countries.
9 For instance, during the period between 1990 and 2019 India , Pakistan and Bangladesh experienced different degrees of progress toward increasing their HDIs (see Figure 2). 4 Figure 2: HDI trends for India , Pakistan and Bangladesh, 1990-2019 India s 2019 HDI of is above the average of for countries in the medium human Development group and above the average of for countries in South Asia. From South Asia, India is compared with Bangladesh and Pakistan, which have HDIs ranked 133 and 154, respectively (see Table B). Table B: India s HDI and component indicators for 2019 relative to selected countries and groups HDI value HDI rank Life expectancy at birth Expected years of schooling Mean years of schooling GNI per capita (2017 PPP US$) India 131 6,681 Bangladesh 133 4,976 Pakistan 154 5,005 South Asia 6,532 Medium HDI 6,153 3- Inequality-adjusted HDI (IHDI) The HDI is an average measure of basic human Development achievements in a country .
10 Like all averages, the HDI masks inequality in the distribution of human Development across the population at the country level. The 2010 Human Development Report introduced the IHDI, which takes into account inequality in all three dimensions of the HDI by discounting each dimension s average value according to its level of inequality. The IHDI is basically the HDI discounted for inequalities. The loss in human Development due to inequality is given by the difference between the HDI and the IHDI, and can be expressed as a percentage. As the inequality in a country increases, the loss in human Development also increases. We also present the coefficient of human inequality as a direct measure of inequality which is an unweighted average of inequalities in three dimensions. The IHDI is calculated for 152 countries.