Transcription of Indian Ceramic Tile Industry Organised sector to …
1 1 Indian Ceramic Tile Industry Organised sector to benefit from changing demographics and preferences During the last two decades, the Indian Ceramic Tile Industry (ICTI) has recorded a phenomenal growth in product profile, geographical spread and value-added products. Largely dominated by family-owned and managed units, the ICTI was the world s third largest manufacturer of Ceramic tiles at 825 million square metres (MSM) in CY14 (refers to the period January 1 to December 31), after China and Brazil. India is also the third largest consumer of tiles in the world, accounting for about of global Ceramic tile consumption in CY14 (Refer Table 1 for top 5 producing and consuming countries). Morbi (Gujarat) is India s largest Ceramic tile-making cluster with over 600 units manufacturing glazed tiles, sanitaryware and vitrified tiles.
2 Approximately 70% of India s total production of tiles is done by units located in this region. Morbi is also a top exporter of Ceramic tiles to Africa and the Gulf Cooperation Council (GCC) region. Table 1: Top 5 producers and consumers of Ceramic tiles Production (In MSM) Country CY10 CY11 CY12 CY13 CY14 % world production China 4,200 4,800 5,200 5,700 6,000 Brazil 754 844 866 871 903 India 550 617 691 750 825 Spain 366 392 404 420 425 Indonesia 287 320 360 390 420 Consumption (In MSM) Country CY10 CY11 CY12 CY13 CY14 % world consumption China 3,500 4,000 4,250 4,556 4,894 Brazil 700 775 803 837 853 India 557 625 681 718 756 Indonesia 277 312 340 360 407 Vietnam 330 360 254 251 310 Indian Ceramic Tile Industry August 23, 2016 Ratings Indian Ceramic Tile Industry 2 Consistent growth of the Organised sector during last four years backed by increase in product portfolio and geographical reach The ICTI is highly fragmented with presence of numerous family-owned entities apart from some very large integrated manufacturers leading to high level of competition.
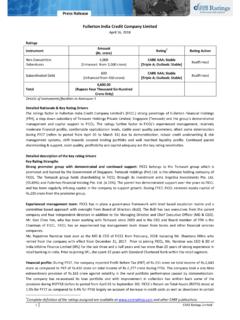
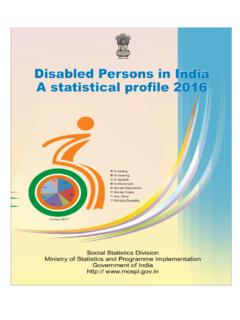
3 The unorganised sector accounts for nearly 50% of the ICTI, represented by more than 500 family-owned entities and around 15 entities in the Organised segment. The composition of the ICTI provided opportunity for consolidation and scaling up the operations by the entities in the Organised segment in a cost-effective manner. During the four years ended March 2015, there has been continuous increase in installed capacity, through organic and inorganic expansions by the Organised players (Refer Chart 1 for installed capacity of 11 leading players). The manufacturers have resorted to either of the above investment methodology depending upon their requirements and feasibility; majority of the capacity addition has been through entering in to Joint Venture (JV) agreements with small and medium scale players or outright acquisition of existing operational units.
4 Organised players benefit from local expertise and faster penetration in the region through meeting local demand with local supply and immediate scaling up of operations. Furthermore, inorganic expansion has helped Organised players to generate higher returns through lower capital commitment and de-leverage their balance sheet from higher cash flow generated through incremental sales volume. Unorganised and small players, too, stand to gain from the partnership as they are assisted by larger entities in streamlining their manufacturing operations and generate economies of scale, expand geographical reach through use of well-established marketing channels of Organised players and ensure compliance of stringent pollution control norms of the State and Central Government s Pollution Control Boards.
5 Chart 1: Installed Manufacturing Capacity of 11 leading players 0 50 100 150 200 250 FY12 FY13 FY14 FY15 MSM Installed Capacity in MSM Ratings Indian Ceramic Tile Industry 3 Demonstrated consistent growth in income and profitability; improved leverage despite challenging Industry scenario The total operating income (TOI) of 12 leading players grew at a compounded annual growth rate (CAGR) of 16% during 4 years ended FY15. This growth was primarily driven by increase in sales volume and higher sales realisation. ICTI is a volume-driven Industry and freight is the second most important cost component, after power and fuel cost. While institutional sales are a high volume generator, the operating margin is lower coupled with elongated credit period and high inventory turnover.
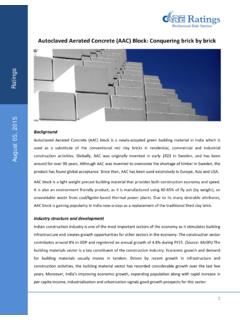
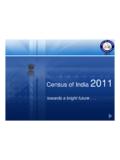
6 However, retail sales are primarily channeled through dealer and distributor network which yields higher sales realisation and operating margin. Introduction of vitrified and porcelain tiles, focus on value-added products and investment in branding and advertisements has enabled the manufacturers to reach out to a larger customer base. Furthermore, most of the Organised players were able to pass on the increase in cost (primarily power and fuel) to their customers on the back of their established brand and strong position in the retail market. PAT margin also improved from during FY12 to during FY15 on account of improvement in operating margin (PBIDT1/TOI) and reduction in interest cost of majority of the manufacturers on y-o-y basis (Refer Chart 2 for operating performance of 12 leading manufacturers).
7 Chart 2: Operating performance Continuous growth in the scale of operations and PAT during 4 years ended FY15, infusion of equity and reduced reliance on external debt resulted in substantial de-leveraging of balance sheet and improvement in overall capital structure. The accretion to net worth was primarily utilised to fund capacity expansion, acquisition and meet working capital requirements. The Ceramic tile Industry is highly working capital intensive (especially 1 Profit before Interest, Depreciation and Tax 4371 5037 5603 6784 159 203 200 286 0 1 2 3 4 5 6 0 1000 2000 3000 4000 5000 6000 7000 8000 FY12 FY13 FY14 FY15 (Percentage) (Rs. Crore) TOI and Profitability Total Income PAT PAT Margin Ratings Indian Ceramic Tile Industry 4 institutional sales) and approximately 50% of average total debt of entities constituted of working capital bank borrowings.
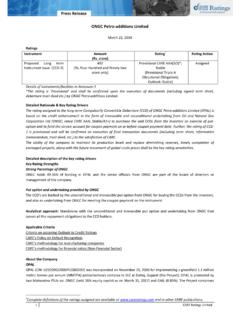
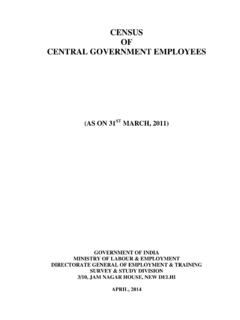
8 While most of entities continue to increase their manufacturing capacities, either through in-house brownfield or greenfield expansion or picking up stake in smaller companies, the same is not expected to adversely impact their leverage given their healthy cash accruals and periodic equity infusion as similar trend was witnessed in the past. Chart 3: Capital Structure and overall gearing Key growth drivers for ICTI The ICTI enjoys the unique advantage of being largely indigenous with abundance of raw materials, labour, technical skills and infrastructural facilities. It is estimated that the ICTI employs over a half million people, both directly and indirectly. Despite slowdown in the real estate sector and adverse macroeconomic environment, low per capita consumption of tiles in India, rapid urbanisation, increasing disposable income of nuclear families and untapped rural market and stable replacement demand is envisaged to augur well for the ICTI.
9 Low per capita consumption of tiles among the developing countries India has one of the fastest growing Ceramic tiles markets in the world. Despite increase in consumption, per capita consumption of Ceramic tiles in India is only square metres (SQM). India lags behind Brazil, China and Vietnam which have per capita consumption of , and SQM respectively (Refer Chart 4 for per capital consumption by top 10 countries). This exhibits an exponential growth potential for ICTI in conjunction with demographic and rising urban population in India. 1051 1268 1529 1865 1186 1290 1139 1108 0 500 1000 1500 2000 FY12 FY13 FY14 FY15 (Times) (Rs. Crore) Capital Structure Net Worth Total Debt Gearing Ratings Indian Ceramic Tile Industry 5 Chart 4: Top 10 nations with highest per capita consumption Levy of anti-dumping duty on imports of vitrified tiles from China Till 2013, there was anti-dumping duty on Chinese vitrified tiles.
10 However, after the removal of duty by the union government, Chinese companies dumped tiles in India which exerted pressure on domestic tile manufacturers (mainly based out of Morbi) on account of lower freight rates from China to South India. After analyzing the Industry wide impact and to encourage domestic manufacturers, the union government imposed an anti-dumping duty of per SQM on all vitrified tiles imported from China in March 2016. This move is expected to provide level playing field to the Ceramic players operating especially in South India. Tile forms a small component of flooring material paves path for substantial growth from untapped geographies Tiles provide unique advantages in terms of water absorption rate, resistance, design and durability over other conventional modes.