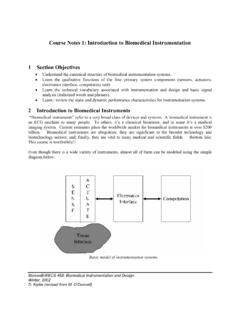
Transcription of Instrumentation Overview - Integrated Systems
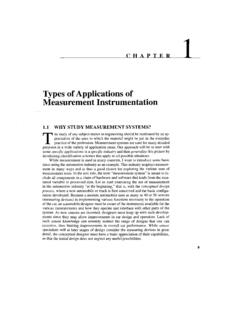
1 Industrial Instrumentation An Introduction AN Overview OF INDUSTRIAL measurement AND CONTROL Systems Level 1 Bryon Lewis Industrial Instrumentation Bryon Lewis Level 1 2002 all rights reserved 1 INDUSTRIAL measurement AND CONTROL Systems Level 1 Introduction This course will introduce the methods to apply Instrumentation and control for use in industrial processes. It will show the proper way to install and calibrate basic instruments, as well as the use of controllers, control modes, and control loops. Industrial Instrumentation employees the use of applied physics to monitor and regulate processes. Instrumentation can be found in any number of the following industries, gas and petrochemical, food processing, pharmacutical, paper and pulp, waste water and water treatment plants are just a few examples. Objectives The objectives of this course will be as 1.
2 Read P&IDs (process and Instrumentation diagrams). 2. Read instrument loop diagrams. 3. To be able to install and calibrate basic instruments. 4. Apply basic Instrumentation to control an industrial process. 5. Apply simple design of control loops used in processes. 6. Understand feedback, feedfoward, cascade and ratio control. Industrial Instrumentation Bryon Lewis Level 1 2002 all rights reserved 2 INDUSTRIAL measurement AND CONTROL Systems Part 1 Course Objectives Basic Instruments 1. Instrumentation Symbols and Terminology a. Symbols, nomenclature and usage b. P&IDs, Mechanical Flow Diagrams c. Loop Diagrams 2. Basic Measurements a. Basic Concepts i. Standard signals used in Instrumentation ii. Instrument ranging and limitation iii. Span, Upper range value and Lower range value iv. Constant current and constant voltage v. Static equilibrium in instrument measurements vi. Open Systems vii. Closed Systems b. Pressure measurements i. Static pressure and Head measurements ii.
3 Differential pressure and Head measurements iii. Vacuum measurements iv. Calibration c. Level measurements i. Wet Legs ii. Suppressing the Zero iii. Elevating the Zero d. Temperature measurements i. Thermocouples 1. J type, K type, E type, T type (most commonly used) ii. RTD (resistance temperature detectors) 1. 100 ohm platinum (most commonly used) 2. Bridge measurement application 3. Constant current measurement application iii. Capillary tubes and thermometers e. Flow and Mass Flow measurements i. Differential pressure and Head to measure flow ii. Meter Types 1. Magnetic 2. Orifice 3. Venturi 4. Vortex 5. Turbine iii. Mass Flow measurement 1. Electrical and Mechanical 2. Pressure + Delta Pressure + Temperature 3. Mass flow is proportional to Force measured 3. Open discussions of applications and experiences Industrial Instrumentation Bryon Lewis Level 1 2002 all rights reserved 3 INDUSTRIAL measurement AND CONTROL Systems Part 2 Course Objectives Process Control 1.
4 Control loops a. Principles of operation and terminology b. Open loop control c. Closed loop control d. Single loop controls e. Cascade controls (outer and inter loop) f. Wiring of instruments and controllers 2. Control Modes g. PID control modes i. Proportional control mode ii. Integral control mode iii. Derivative control mode iv. Application of the three types of control modes h. Differential Gap Control i. Split Range Control j. Time Proportioning Control 3. Final Correction Devices k. Valves i. Type of valves ii. Valve terminology, trim, and characterization iii. Applications of equal percentage, linear and quick opening vales l. Pumps i. Types ii. Applications iii. Control and interlocking to process controller 1. Alarms 2. Starting and stopping 3. Shutdown Systems 4. Applications of measurement , process control and P&IDs 5. Open discussions of applications and experiences End of Course Industrial Instrumentation Bryon Lewis Level 1 2002 all rights reserved 4 Section 1 Basic Instruments Loop Diagram Symbols and P&IDs P&IDs AND LOOP DIAGRAMS P&IDs and loop diagrams are construction and documentation drawings that depict the flow of the process and illustrate the Instrumentation control and measurement interactions, wiring and connections to the process.
5 The process is illustrated in sections or subsystems of the process called loops. A loop diagram will detail the connections of pneumatics and wiring from the field device through any junction boxes or marshalling cabinet to the controller or computer interface which controls the process a single loop or a cascade loop of the process. This section will focus on the standard symbols, identification tags and terminology used in the industry. In the areas of engineering, design, drafting, installation and maintenance of an industrial Instrumentation and control system, a solid understanding of the symbols and terminology used to depict the process system is required. This course will use the ISA/ANSI standards shown in this section for all process illustrations. ISA (International Society of Automation) / ANSI (American National Standards Institute). Instrument line symbols ALL INSTRUMENT LINES ARE TO BE DRAWN FINE IN RELATION TO THE PROCESS PIPING LINES.
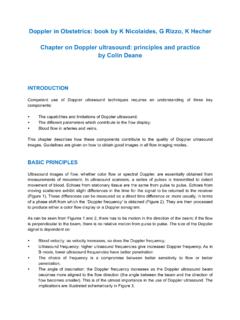
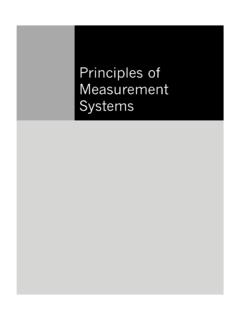
6 Common connecting lines Connection to process, or instrument supply: Pneumatic signal: Electric signal: Capillary tubing (filled system): Hydraulic signal: Electromagnetic or sonic signal (guided): Internal system link (software or data link): Source: Data from ISA standard Industrial Instrumentation Bryon Lewis Level 1 2002 all rights reserved 5 Section 1 Basic Instruments Loop Diagram Symbols and P&IDs Tagging nomenclature The following table illustrates standard tagging to use for instrument identification. P&ID TAG DESIGNATIONS TYPICAL TAG NUMBER TIC 103 - Instrument Identification or Tag Number T 103 - Loop Identification 103 - Loop number TIC - Function Identification T - First Letter (measured variable see table 2) IC - Succeeding Letters (modifier, readout or function) EXPANDED TAG NUMBER 10-PHA-5A - Tag Number 10 - Option Prefix A - Option Suffix Note: Hyphens are optional as separators The top of the tag will identify the instrument type and the bottom will identify the loop number.
7 Refer to tagging nomenclature tables above. Remember the loop number is just a section or sub system of the process. General instrument or function symbols Primary location accessible to operator Field mounted Auxiliary location accessible to operator Discrete instruments Shared display, shared control Computer function Programmable logic control 1. Symbol size may vary according to the user's needs and the type of document. 2. Abbreviations of the user's choice may be used when necessary to specify location. 3. Inaccessible (behind the panel) devices may be depicted using the same symbol but with a dashed horizontal bar. Source: Data from ISA standard Industrial Instrumentation Bryon Lewis Level 1 2002 all rights reserved 6 Section 1 Basic Instruments Loop Diagram Symbols and P&IDs The table below shows the recommended tag identification letters for instruments and control element designations used in P&IDs and Loop Diagrams. Identification letters First letter Succeeding letters Measured or initiating variable Modifier Readout or passive function Output function Modifier A Analysis Alarm B Burner, combustion User's choice User's choice User's choice C User's choice Control D User's choice Differential E Voltage Sensor (primary element) F Flow rate Ration (fraction) G User's choice Glass, viewing device H Hand High I Current (electrical) Indication J Power Scan K Time, time schedule Time rate of change Control station L Level Light Low M User's choice Momentary Middle, intermediate N User's choice User's choice User's choice User's choice O User's choice Orifice, restriction P Pressure, vacuum Point (test connection)
8 Q Quantity Integrate, totalizer R Radiation Record S Speed, frequency Safety Switch T Temperature Transmit U Multivariable Multifunction Multifunction Multifunction V Vibration, mechanical analysis Valve, damper, louver W Weight, force Well X Unclassified X axis Unclassified Unclassified Unclassified Y Event, state, or presence Y axis Relay, compute, convert Z Position, dimension Z axis Driver, actuator Source: Data from ISA standard Industrial Instrumentation Bryon Lewis Level 1 2002 all rights reserved 7 Section 1 Basic Instruments Loop Diagram Symbols and P&IDs Elements and Final Correction Devices Final Element AV BZ EZ FV FQV HV IZ JZ KV LV PV PDV QZ RZ SV TV TDV Safety Devices PSV PSE TSE UV VZ WZ WDZ YZ ZV ZDV Viewing Device, Glass BG FG LG Well or Probe AW BW LW RW TW TW Test Point AP FP PP PP TP TP Primary Element AE BE EE FE FQE IE JE KE LE PE PE QE RE SE TE TE VE WE WE YE ZE ZDE Solenoids Relays.
9 Computing Devices AY BY EY FY FQY IY JY KY PY PDY QY RY SY TY TDY UY VY WY WDY YY ZY ZDY Transmitters Blind AT BT ET FT FQT IT JT KT LT PT PDT QT RT ST TT TDT VT WT WDT YT ZT ZDT Indicating AIT BIT EIT FIT FQIT IIT JIT KIT LIT PIT PDIT QIT RIT SIT TIT TDIT VIT WIT WDIT ZIT ZDIT Recording ART BRT ERT FRT FQRT IRT JRT KRT LRT PRT PDRT QRT RRT SRT TRT TDRT VRT WRT WDRT ZRT ZDRT Switches and Alarm Devices Comb ASHL BSHL ESHL FSHL HS ISHL JSHL KSHL LSHL PSHL PDSHL QSHL RSHL SHHL TSHL TDSHL VSHL WSHL WDSHL ZSHL Low ASL BSL ESL FSL FQSL FFSL ISL JSL KSL LSL PSL PDSL QSL RSL SSL TSL TDSL VSL WSL WDSL YSL ZSL ZDSL High ASH BSH ESH FSH FQSH FFSH ISH JSH KSH LSH PSH PDSH QSH RSH SSH TSH TDSH VSH WSH WDSH YSH ZSH ZDSH Readout Devices Indicating AI BI EI FI FQI FFI II JI KI LI PI PDI QI RI SI TI TDI UI VI WI WDI YI ZI ZDI Recording AR BR ER FR FQR FFR IR JR KR LR PR PDR QR RR SR TR TDR UR VR WR WDR YR ZR ZDR Controllers Self- Actuated Control Valves FCV FICV KCV LCV PCV PDCV SCV TCV TDCV WCV WDCV ZCV ZDCV Blind AC BC EC FC FFC HC KC LC PC PDC RC SC TC TDC WC WDC YC ZC ZDC Indicating AIC BIC EIC FIC FQIC FFIC HIC IIC JIC KIC LIC PIC PDIC QIC RIC SIC TIC TDIC WIC WDIC YIC ZIC ZDIC Recording ARC BRC ERC FRC FQRC FFRC IRC JRC KRC LRC PRC PDRC QRC RRC SRC TRC TDRC WRC WDRC ZRC ZDRC Process Variable Initiating or Measured Variable Analysis Burner/combustion User' Choice User' Choice Voltage Flow Rate Flow Quantity Flow Ratio User' Choice Hand Current Power Time Level User' Choice User' Choice User' Choice Pressure\Vacuum Pressure Differential Quantity Radiation Speed\Frequency Temperature Temperature Differential Multivariable Vibration\Machinery Analysis Weight/Force Weight/Force Differential
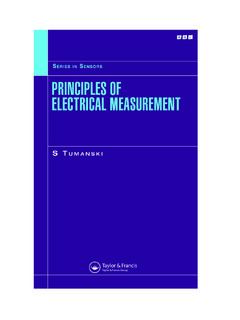
10 Unclassified Event/State/ Presence Position/Dimension Gauging Deviation First Letter A B C D E F FQ FF G H I J K L M N O P PD Q R S T TD U V W WD X Y Z ZD Industrial Instrumentation Bryon Lewis Level 1 2002 all rights reserved 8 Section 1 Basic Instruments Loop Diagram Symbols and P&IDs P&ID (process and Instrumentation diagram) MECHANICAL FLOW (simplified diagram) Industrial Instrumentation Bryon Lewis Level 1 2002 all rights reserved 9 Section 1 Basic Instruments Loop Diagram Symbols and P&IDs This P&ID diagram illustrates the use of software data links between controllers. These controllers communicate over a communications bus and pass variables back and forth between the IOP (input output processor) sections of the DCS. The communications processor will then put the information in memory for the control blocks of the program to use. Some controllers can use Ethernet or Field Bus to communicate and pass the process variables back and forth.