Transcription of INSTRUMENTATION PRINCIPLES FOR PERFORMANCE …
1 EintrrY Vol. 4, pp. 561-573 0360-5442/79/Gl!Ol-05611$ Pergamon Press Ltd., 1979. Printed in Great Britain INSTRUMENTATION PRINCIPLES FOR PERFORMANCE MEASUREMENT OF SOLAR HEATING SYSTEMS NoAM LIOR Department of Mechanical Engineering and Applied Mechanics, University of Pennsylvania, Philadelphia, PA 19104, (Received l July 1978) Abstract-An INSTRUMENTATION design and implementation plan for monitoring the PERFORMANCE of solar heating systems and of their components is described. Specifically the selection of the data acquisition system and of the sensors, the procurement process and installation and calibration PRINCIPLES are discussed in detail. As a practical example, the cost and choice of measurement methods and instruments used in the University of Pennsylvania SolaRow house is presented.
2 I. INTRODUCTION t. t Background and major issues A rapidly increasing number of systems utilizing solar heat are being installed and operated, mainly through government initiative and support. A major objective of these installations is to derive quantitative information about their PERFORMANCE so as to allow state of the art evaluation. This will provide a foundation for PERFORMANCE improvement and cost reduction of solar heating equipment and systems, thereby accelerating their widespread utilization. Due to the moderate ranges of the variables, the above measurements are not difficult. However, they do pose a number of specific problems which have not always been recognized and carefully addressed, thereby resulting in the current scarcity of PERFORMANCE data in general and of good data in particular (see Scovill and Gillett').
3 The most important of these problems are: (1) the significantly transient and stochastic nature of weather, insolation and heat demand, (2) the relatively small temperature differences that need to be measured, and (3) the relatively low system ftow rates and wide ftow range which frequently occurs in solar systems. Transient data The stochastic variables necessitate the collection and analysis of an extremely large amount of data over long periods of time, a full heating or cooling season, or a whole year. These data are presently acquired by different investigators at a variety of frequencies: continuous monitoring (such as by means of strip-chart recorders or high-speed data acquisition systems); intermittent scanning at rates such as once per minute, per 5 min, per 15 min, or per hr; and long term integration which is recordt>d once a day, a week, a month, or a season.
4 Long term integration provides the simplest and most economical method, but it does not provide the detailed PERFORMANCE data which are frequently needed for system and component evaluation. It is also virtually useless for system optimization and trouble shooting. When continuous or frequently scanned data are acquired, expensive data acquisition systems (DAS) are needed, and data reduction must be performed by computer. Furthermore, the reliability of such equipment is usually not compatible with the requirement for its continuous use over periods of the order of one year. This requirement also imposes (l) the necessity to select highly reliable sensors, (2) the necessity to give serious consideration to the question of DAS and sensor calibration without undue interruption of system operation and measurement, (3) the need to use an uninterruptible power supply for the INSTRUMENTATION system , and (4) a significant investment of skilled manpower to supervise the operation of the measurement system .
5 The latter task includes maintenance, calibration, data collection and interpretation for a lengthy period of time on an around-the-clock alert basis. Data reduction and interpretation for a large number of installations may be handled by a single remote centralized facility ( as described by Murphy2) and thus save time and insure uniform treatment. However, for many important and obvious reasons, the on-site expernnenter is irreplaceable. 561 562 N. LIOR Measurement of small temperature differences Temperature differences are measured to determine: (l) Heat gain or loss (Q) of flowing fluids through a system 's components between times t1 and t2 by means of the equation fl2 fl2 Q= mc(Tout-T;Jdt= pVAc~T0;dt It It (1) where m, mass flow rate of fluid; c, specific heat of fluid; Tout.)
6 Temperature of fluid at outlet; T;no temperature of fluid at inlet; Ito t2, time integration limits; p, density of fluid; V, velocity of fluid; A, cross sectional flow area in conduit at location where V is measured; ~To;. temperature difference measured between the fluid's inlet and outlet. (2) Rates of heat exchange (q), or heat transfer coefficients ( U) by means of the equation (2) where A is the heat transfer area and ~ T12 is the temperature difference measured across a heat transfer interface between medium No. 1 and medium No. 2. (3) Efficiency of solar collectors to which the Hottel-Woertz equation is applicable: (3) Equation (3) shows that only the temperature differences, ~ T;a and ~To;. are necessary to describe the behavior of the collector's efficiency f/, where /, insolation flux; FR.
7 Collector heat removal factor; (aT)., effective absorptance-transmittance product of collector in solar radiation spectrum; UL, collector's overall heat loss coefficients; Ta, ambient air temperature; ~ T;a = T;-Ta. Assuming that measurement of temperature T is characterized by the standard deviation error u, the relative error Er could be described by Er = u/T. (4) Now if temperature differences ~Tare measured, assuming that the errors of the two probes used are independent and have a value of u each, the relative standard deviation error of the temperature difference measurement, tu, is E&T = ('y2)u/~T. (5) In a worst case situation, where the errors accumulate directly, Eu,max = 2u/~T. (6) The error expression (5) gives values which are typically larger than those obtained from (4).
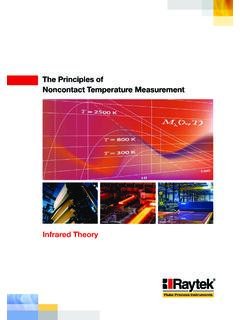
8 The ratio of the two is (7) and in the worst case (8) E&11T is plotted in Fig. 1 as a function of ~T. for T = {0. 80, and 130 C. Given a Coefficient of Variation Er for an instrument for the measurement of "absolute" temperature, Fig. 1 shows how much larger the Coefficient of Variation for temperature difference measurement (error E&r) is. For example, given a thermometer which has an tr of 1/2% of full scale, a system of two such thermometers used to measure a temperature difference would have a relative error -113 times larger than that (Eu = ) for~ T = l C, and an error INSTRUMENTATION PRINCIPLES for PERFORMANCE measurement of solar heating systems 180 110 140 120 .. ;::100 t' 80 60 40 20 ~~~2~~4~~6~~~~~10~~12~~14;;;1~6;. ~1~8~g20" AT, C Fig.}
9 I. The effect of small temperature differences (An on the relative error incurred by subtracting the two measurements, tAm"" (uA7/An (u.,tn- u "' standard deviation of the measurement error. 563 -11 times larger (Eu = ) for ~T = lO"C, all at a level of T = 80"C. Keeping in mind that the Coefficient of Variation represents only about l/3 of the total error (since 3u contains a probability of ), and that the maximal error may be represented by Eqs. (6) and (8) instead of (5) and (7), the actual error may be larger than that indicated above. Equation (5) and Fig. 1 can also be used to determine the allowed u of a thermometer (this is a manufacturer's specification) so that the tolerable Eu is obtained, thereby facilitating instru-ment selection.)))
10 The desired quantities Q and 11 in Eqs. OH3) depend linearly on their respective tJ. T values, and thus any error incurred in tJ. T measurement is impressed directly on those final results. This indicates the importance of reducing these errors by the proper selection of instruments or measurement techniques. Several techniques can be used to improve the accuracy of ~ T measurement. Probably the most straightforward is to perform two measurements of ~ T, exchanging the positions of the two thermometers for the second measurement. This eliminates the major effect of an offset error between the two probes, but is not easy to implement mechanically and is ineffective under the transient conditions incurred with solar heating and cooling systems.