Transcription of Interpretation of Falling Weight Deflectometer data
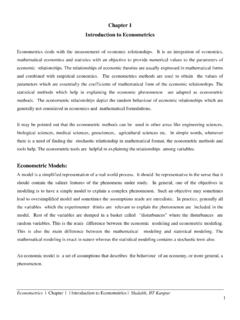
1 1 Interpretation of Falling Weight Deflectometer data Animesh Das1 Introduction In Falling Weight Deflectometer (FWD) test an impulsive load is applied on the road surface. The magnitude of the load, duration and area of loading is so adjusted that it corresponds to the effect of loading due to standard axle on in-service pavement (Sebaaly et al. 1991). The instantaneous deflections of the road surface is measured at a number of points at different distances radially outward from the centre of the Falling Weight .
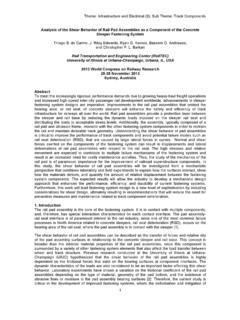
2 Thus, the shape of deflection bowl is obtained. Information on structural health condition can be extracted from analysis (by backcalculation) of the FWD data. Figure 1 presents a schematic diagram of a FWD (Das and Pandey 1998). Figure 1: Schematic diagram of Falling Weight Deflectometer The backcalculation process The purpose of back-calculation is primarily to find out the in-situ elastic moduli (E) of the different pavement layers. In this process, the deflections values are calculated for assumed elastic moduli values, compared with the observed deflection values, and accordingly the assumed moduli values are further adjusted for the next iteration.
3 The iteration continues until the calculated and observed deflection values match closely. This is schematically explained in Figure 2. Further, the pavement layer thickness values may also be unknown, and these can also be estimated iteratively through the back-calculation process. 1 Associate Professor, Department of Civil Engineering, Indian Institute of Technology Kanpur, Kanpur 208 016, e-mail: 2 Figure 2: Schematic diagram representing the process of backcalculation Due to idealizations involved in analyzing pavement structure, numerical errors get introduced during iterations, and due to the inverse nature of the problem no unique solution may be achieved in the backcalculation process (Ceylan et al.)
4 2005, Chou and Lytton 1991; Hall and Mohseni 1991, Ulliditz and Stubswtad 1985). Efforts are being made to evolve a robust backcalculation scheme (May and Von Quintus 1994) that can reach the solution accurately, reliably and quickly. Various approaches based on closed formed solutions (Hall and Mohseni 1991; Scrivner et al. 1973), regression and database search (Ali and Khosla, 1987; Anderson 1989; Chou and Lytton 1991; Mohaney et al. 1993; Roque et al. 1998;), optimization techniques (Bush III and Alexander 1985; Harichandran et al.
5 1993; Sivaneswaran et al. 1991) and combination of these methods have been proposed for backcalculation of layer moduli (Goel and Das 2008; Sharma and Das 2008). Each method of backcalculation has some advantages as well as limitations (Sharma and Das 2008). The closed formed solution can handle only limited and idealistic situations. The regression methods are fast, but sometimes give inaccurate results (Harichandran et al. 1993; Lenngren, 1991). The methods based on optimization techniques (classical or evolutionary) may take a lengthy iteration process (Fwa et al.
6 1997; Harichandran et al. 1993, Meier and Rix 1994; Sharma and Das, 2008). There are chances that the solution may converge to a local optimal point (Hall and Mohseni 1991). Application of FWD test results It is difficult to simulate the exact the field conditions in the laboratory, hence it is difficult and time consuming task to estimate the stiffness values at field conditions through laboratory 3 testing. Backcalcuation of FWD data provides quick information on the in-situ stiffness values of the individual layers.
7 The stiffness values can be studied over a period to time to assess the trend in the structural deterioration of pavement. If required, overlay thickness can be designed. For design of overlay thickness, the existing pavement structure (with the stiffness values estimated by FWD) along with the tentative overlay thickness can be analysed to obtain the critical strain value(s). The tentative thickness of the overlay thickness can be adjusted iteratively so that the critical strain(s) become(s) close to the allowable strain value for the extended design life (expressed in terms of cumulative traffic repetitions).
8 Figure 3 presents a schematic diagram of a typical overlay design chart. Figure 3: Schematic diagram of overlay design chart The stiffness values of the individual layers can also be used to develop various structural health indices at network level (Galal et al. 2007; Zhang et al. 2003), and can be used remaining life calculations (Arnold et al. 2009; Kim and Park 2002). The interface bonding conditions can be considered in the analysis routine, and therefore, it may be possible to assess the interface bond conditions while performing backcalculation on FWD data (Romanoschi and Metcalf 2003).
9 Further, FWD data may be used to identify void or local anomaly or identification of rigid layer underneath. For concrete pavement it can be used to evaluate the load transfer efficiency of the joints. Closure Various equipment are available for non-destructive evaluation of structural health of pavement. Based on the working principles, these can be classified in two major groups, deflection based method and wave propagation based method (Goel and Das 2008). Static loading, steady state loading, impulsive loading etc.
10 Are different types of deflection based methods; stress wave, electromagnetic method etc. are different types of wave propagation method (Goel and Das 2008). FWD (impulsive loading equipment) can be efficiently used for estimation of in-situ stiffness values and thickness of the pavement layers. 4 Acknowledgement The author thanks Ms. Heena Dhamana, Master s student, Department of Civil Engineering, IIT Kanpur, for preparing the schematic diagrams presented in this article. References Ali, N. A., and Khosla, N.