Transcription of Interpreting DMA curves, Part 1 - Mettler Toledo
1 Thermal Analysis Application No. UC 151. Thermal Analysis Application Application published in Mettler Toledo Thermal Analysis UserCom 15. Interpreting DMA curves , part 1. The first part of this work introduces the technique of dynamic mechanical analysis (DMA) and deals with non- isothermal DMA measurements. The second part (UserCom16) will cover various aspects of isothermal meas- Fig. 1. DMA/SDTA861e measurement modes: 1 shear; 2 three-point bending; 3 dual cantile- urements, concentrating primarily on ver (similar to bending but the sample is fixed); 4 single cantilever; 5 tension for thin bars, frequency-dependent elasticity.
2 Films and fibers; 6 clamping assembly is colored black and the sample red. The hatched areas show the parts of the clamping assemblies that remain fixed in po- sition. Introduction By the term elasticity we mean the way in which materials change their shape through the action of external forces. The modulus of elasticity of a material is the ratio of the mechani- cal stress to the relative deformation. In Dynamic Mechanical Analysis, DMA, a sample is subjected to a si- nusoidal mechan ical deformation of frequency, f, and the corresponding forces measured. Conversely, the sample can be sub- jected to a defined force amplitude and the resulting deformation meas- ured.
3 Measurement modes A number of different measurement mo- Fig. 2. Force and displacement at a frequency (f) of 1 Hz. The phase shift, , can be calculated des are used: from the time delay, , using the equation = 2 f . - Shear for samples with a shear modu- - Three-point bending for stiff samples - Tension for thin bars, films and lus in a very large range from about with a modulus of elasticity of up to fibers. 1 kPa to 2 GPa. This allows viscous 1000 GPa. - Compression for samples with a liquids and even solid samples , - Single and dual cantilever bending modulus of elasticity of up to about polymers in the glassy state, to be for samples that deform too strongly 1 GPa.
4 Measured. with three-point bending. The quantities measured The raw data, the measured force and displacement amplitudes, Fa and La, and their phase shifts, , are used to calcu- late the desired material properties: Thermal Analysis Application Complex modulus (M*): modulus of elasticity, Young's modulus (E*) or shear modulus (G*). Storage modulus, M , proportional to the energy stored elastically and reversibly Loss modulus, M , proportional to the energy transformed into heat and irre versibly lost Loss factor, tan . With completely elas tic materials no phase shift, , occurs; completely viscous materials show a 90 phase shift.
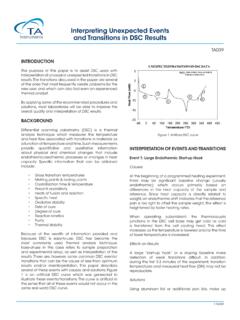
5 The loss fac- Fig. 3. The linear presentation of the modulus overemphasizes the region with high va- tor of viscoelas tic materials is between lues. The point of inflection of the storage modulus corresponds approximately to the 0 and infinity ( = 90 ). maximum of the loss modulus. The latter is often referred to as the glass transition The term tan corresponds to the temperature, Tg, at the frequency concerned. Because tan = G'' / G', the maximum ratio of M to M'. of tan is at higher temperature. At the point of intersection of G' and G'', tan = 1. Sample: SBR, 1 Hz, 2 K/min.
6 The moduli are calculated according to the following formulas: where g is known as the geometry factor calculated from the sample dimensions. E and G are related by Poisson's ratio, : E = 2 (1+m) G. For most isotropic materials, lies between and , and E is to maximum 3 times greater than G. In the rubbery-elas tic region of unfilled materi- Fig. 4. Same measurement as in Figure 3, but displayed in the usual logarithmic presentation. Compared with the linear presentation, the low-value region of the modulus now appears scale- als, E 3 G and in the glassy state expanded. In this presentation, Tg corresponds to the onset of the decrease of G'.
7 The loss factor E = G. in the rubbery-elastic state is clearly larger than in the glassy state. The ordinate of the loss With anisotropic materials, unidirec factor is displayed on the right of the diagram. tional fiber reinforced plastics, E can the transitions are frequency-dependent, constant displacement amplitude, be more than one hundred times larger they are in fact re laxation transitions, and a maximum force is set that than G. which with increasing frequency shift to should not be exceeded even with stiff higher temperatures. samples . An unsuitable choice of the If a material is heated, the storage displace ment or force amplitude can modu lus decreases step-wise by several Measurement details affect the measurement accuracy.
8 Am- orders of magnitude. The step corre- Usually with DMA measurements, plitudes greater than 1 m and sponds to a peak in the loss modulus. If the measurement is performed at 10 mN are optimal, as long as the Mettler Toledo . TA Application No. UC 151 2. displacement amplitude does not ex- ceed 1% of the corresponding sample dimension. With larger amplitudes, the modulus can change (non-linear- ity of the sample). Thermal Analysis Application Heating rates of 3 K/min are usu ally used because of the low ther- mal conductivity of plastics and the relative ly large samples except for trial meas urements.
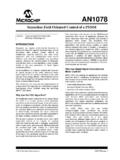
9 The same applies to cooling measurements. To determine the frequency depend- ence, measurements are performed with several frequencies. The fre . quencies can be either mixed (si- multaneous multi-frequency mode). or applied individually one after the other (sequential frequency series). Fig. 5. The storage part of the modulus of elasticity, E', of various materials as a function of temperature. The E' of steel decreases only slightly (210 GPa at room temperature, 177 GPa Besides measurements with a dynamic at 400 C). In contrast, the storage modulus (proportional to stiffness) of organic materials temperature program, the DMA/SDTA861e decreases rapidly in one or more steps.
10 Tg is the glass transition temperature and Tm the melting can also perform isothermal measure temperature. CFE is a carbon fiber-reinforced epoxy resin, PP polypropylene, PS polystyrene, and NR natural rubber. ments with increments of increasing or decreasing frequency, displacement amplitude and force amplitude. The presentation of DMA curves Since moduli can change by several or- ders of magnitude, a linear presentation cannot adequately display the measure- ment data (Fig. 3). For example, a step of 1 GPa to 10 MPa cannot be distin- guished from a step of 1 GPa to 1 MPa.