Transcription of Interpreting Your GRE Scores
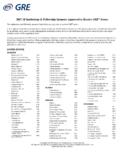
1 2017-18 Interpreting Your GRE Scores This publication is intended to assist you in Interpreting your GRE test Scores .
2 The interpretive information is updated annually. Guidelines for the Use of GRE Scores , which is available at , encourages institutions to use the Scores appropriately. General Test Score Interpretive Information The range of Scores for the Verbal Reasoning and Quantitative Reasoning measures of the GRE General Test is 130 to 170, in one-point increments. The range of Scores for the Analytical Writing measure is 0 to 6, in half-point increments. If you have not answered at least one question within a measure, an NS (No Score) is reported for that measure.
3 Scores from the different General Test measures should not be directly compared because each measure is scaled separately. You can use the percentile ranks provided on your score report to compare your relative performance among the measures. These percentile ranks are based on the Scores of all examinees who tested between July 1, 2013, and June 30, 2016. For the computer-delivered GRE General Test Verbal Reasoning and Quantitative Reasoning measures, your score reflects the number of questions you answered correctly, as well as the difficulty level of each of the sections.
4 For the computer-delivered GRE General Test Analytical Writing measure, each essay receives a score from one trained reader using a six-point holistic scale. The essay is then scored by the e-rater scoring engine, a computerized program developed by ETS that is capable of identifying essay features related to writing proficiency. If the human score and the e-rater score closely agree, the average of the two Scores is used as the final score. If they disagree, a second human score is obtained and the final score is the average of the two human Scores .
5 The resulting Scores on the two essays are then averaged and scaled to produce the Analytical Writing score. For the paper-delivered GRE General Test Verbal Reasoning and Quantitative Reasoning measures, your score is based on the number of questions you answered correctly. For the paper-delivered GRE General Test, each essay receives a score from two trained readers. If the two assigned Scores differ by more than one point, the discrepancy is adjudicated by a third reader. The resulting Scores on the two essays are then averaged and scaled to produce the Analytical Writing score.
6 If you took the computer-delivered General Test, select the GRE Diagnostic Service from your ETS Account ( ) to view information about your performance. Table 1 presents General Test mean Scores based on the Scores of all individuals who took the General Test between July 1, 2013, and June 30, 2016. Table 1: General Test Mean Scores (Based on the performance of all individuals who tested between July 1, 2013, and June 30, 2016) Number of Test Takers Mean Standard Deviation Verbal Reasoning 1,742,748 Quantitative Reasoning 1,745,644 Analytical Writing 1,737,470 Table 2 presents mean Scores for the seven broad intended graduate major fields.
7 (Definitions of statistical terms are presented in the glossary on the back page.) For additional interpretive information about the GRE General Test, including General Test Percentage Distribution of Scores Within Intended Broad Graduate Major Field, visit Table 2: General Test Mean Scores Classified by Broad Intended Graduate Major Field (Based on the performance of seniors and nonenrolled college graduates1 who tested between July 1, 2013, and June 30, 2016) Broad Intended Graduate Major Field Verbal Reasoning Quantitative Reasoning Analytical Writing Business 150 153 Education 151 149 Engineering 149 159 Humanities & Arts 156 150 Life Sciences 151 151 Physical Sciences 150 158 Social and Behavioral Sciences 153 151 1 Limited to those who earned their college degrees up to two years prior to the test date.
8 subject Test Score Interpretive Information The range of Scores for each GRE subject Test is from 200 to 990, in 10-point increments, although the actual range for any particular subject Test is usually smaller.
9 The possible range of subscores is from 20 to 99, in one-point increments. Your subject Test score is based on the number of questions you answered correctly. Because Scores are calculated independently for each test, subject Test Scores should be compared only with other Scores on the same subject Test. A score of 680 on the Mathematics Test, for example, is not equivalent to a 680 on the Physics Test. Scores on the same subject Test generally are directly comparable across years. A Chemistry Test score of 650 in 2017, for example, should be considered equivalent to a Chemistry Test score of 650 earned in 2016.
10 Percentile rank information for your subject Test total score and subscores, if available, is printed on your score report and is based on the Scores of all examinees who tested between July 1, 2013, and June 30, 2016. Note that although a given score represents approximately the same level of ability regardless of when the score was earned, its percentile rank may vary, depending on the Scores of the group with which it is compared. Subscores indicate relative strengths and weaknesses of preparation in subfield areas. Subscore percentile ranks may be used for diagnostic interpretation of the total score.