Transcription of Introduction - Chuck Easttom
1 Basic Descriptive Statistics A Brief Introduction by Chuck Easttom Introduction Statistics is a branch of mathematics designed to allow people to accomplish two goals. The first is to accurately describe data and trends in data. The second is to make predictions on future behavior, based on current data. The first goal is simply called descriptive statistics. Any method or formula which yields some number which tells you about a set of data is referred to as descriptive statistics. Any method or formula which discusses a probability of some event occurring is predictive statistics. In this paper we will discuss descriptive statistics. The goal is to summarize the current level of understanding of basic descriptive statistics and to give some general guidelines for using descriptive statistics. This will be followed by a second paper which discusses probability.
2 Basic Terminology Before we can proceed certain terminology must be covered. Without a thorough understanding of these terms it is impossible for any person to be able to study even rudimentary statistics. Descriptive statistics: Collection, classification, analysis, and interpretation of data. Hypothesis: The idea you are testing. Statistics are usually done in an attempt to confirm or refute some idea. Often in statistics you confirm or refute the null hypothesis, denoted as H0. It is the hypothesis that essentially the results you get are random and are not due to some real relationship. In other words if the null hypothesis is true, then the apparent relationship is really simply a random coincidence. 1 Predictive statistics: Using statistics generated from the sample in order to make predictions, this is also often called inferential statistics.
3 Parameter: This is a descriptive number about a population. A statistic is a descriptive number about a sample. Population: The target group you wish to study, such as all men aged 30 to 40. Sample: The subgroup from the population you select to study, in order to make inferences about the population. Types of Measurement Scales1 1. Nominal: For qualitative data with distinct categories. For example the categories German, French, and Italian are categories but are not ordered in any way. 2. Ordinal: For qualitative data with distinct categories in which ordering (or ranking) is implied. A good example is the Likert scale that you see on many surveys: 1=Strongly disagree; 2=Disagree; 3=Neutral; 4=Agree; 5=Strongly agree. 3. Interval: For quantitative data with an ordered scale in which the interval between data values is meaningful.
4 For example the categories of rank in the military. Clearly a major is higher ranked that a captain, but how much higher? Does he have twice the authority of a captain? It is impossible to say. You can only say he is higher ranked. 4. Ratio: For quantitative data which have an inherently defined zero and the ratio of data values is meaningful. Weight in kilograms is a very good example since it has a definite ratio from one weight to another. 50kg is indeed twice as heavy as 25 kg. Data Collection Normally statistics are done with only a fraction of the actual group being considered. That fraction is called the sample, and the group in question is the population. For example if you 2 wish to find out if men who are over 40 and more then 30 lbs over weight have an increased risk of heart attack, you might select 1000 men to study.
5 The 1000 selected would be your sample, all men over 40 who are more than 30 lbs over weight would be your population. This leads to two obvious questions. Is the sample size you selected large enough and is the sample truly representative of the population you are attempting to measure? The first question is always a controversial one. Obviously the larger the sample size the better. However it is often impractical to get very large sample sizes. For example when political polls attempt to predict the outcome of an election, it is almost impossible to get more than a few thousand peoples opinions. Considering that the United states has a population of 270 million, and tens of millions of eligible voters, it is questionable whether or not such a sample provides is accurate. One way around this is to periodically repeat the study.
6 For example with political polls you may only poll 1000 people, but if you do this many times with the same or similar results each time your results have greater validity. The second question, whether or not your sample is actually representative of the population you are trying to measure, is much easier to answer. There are some very specific ways in which you should select a sample. Using proper sampling techniques will give your statistical analysis credibility. The Statistics Glossary2, lists several sampling techniques, each is described here: Independent Sampling: This occurs when multiple samples are taken, but each sample has no effect on any other. Random Sampling: This occurs when subjects for your sample are picked totally at random with no other factors influencing their selection.
7 For example when names are drawn from a hat, you have random sampling. 3 Stratified Random Sampling: In this process the population is divided into layers based on some criteria and a number of random subjects are taken from each strata. In our example of studying men over 40 and over weight you might break the population into strata based on how much over weight they are, or how old they are. For example you might have men that are 25 to 50 lbs over weight in one strata and those who are 50 to 100 lbs over weight in another, then finally those who are more than 100 lbs over weight. There are other sampling methods but these are very commonly used. If you wish to learn more about sampling methods, the following websites will be helpful: Stat Pac Statistics Finland Australian Bureau of Statistics /116e0f93f17283eb4a2567ac00213517!
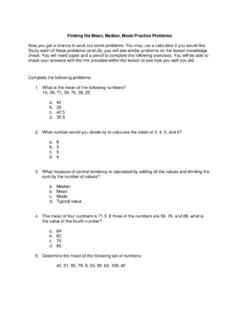
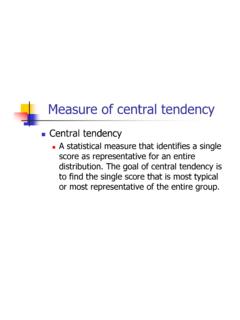
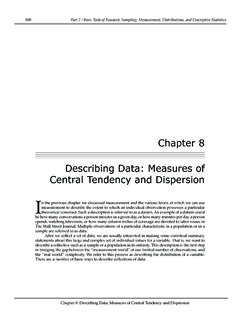
8 OpenDocument When evaluating any statistical analysis it is important to consider how the sampling was done, and if the sample size seems large enough to be relevant. It might even be prudent to never rely on a single statistical study. If multiple studies of the same population parameter, using different samples, yield the same or similar results, then one has a compelling body of data. A single study always has a chance of being simply an anomaly, no matter how well the study was conducted. Measures of Central Tendency The first and simplest sort of descriptive statistics involves measures of central tendency. This is simply a way of seeing what the aggregate of the data tells us about the data. The three most simple measures of central tendency are the mean, median , and mode. The mean is simply the 4 arithmetic average, the mode is the item in the sample that appears most often, and the median is the item that appears in the middle.
9 Let me illustrate. Assume you had a set of test scores as follows: 65, 74, 84, 84, 89,91,93,99,100 The mode is easy, 84 is the only score that appears more than once. The median is the score in the center, which in this case is 89 The mean is found by adding the scores and dividing by the number of scores (in this case 9). The formula for that is mean x= x/n. In this case it would be Another important term is range. The range is simply the distance from the lowest score to the highest. In our example the highest is 100, the lowest is 65, thus the range is 35. You will see these four numbers ubiquitously presented in statistical studies. However what do they really tell us. In this case the arithmetic mean of the scores was actually about dead center of the scores. In our case, all must two of our scores are grouped in a narrow range from 84 to 100.
10 This clustering means that our measures of central tendency probably tell us a lot about our data. But what about situations with much more variety in the numbers? In such cases, the mean may not tell us much about the actual data. This leads to other measures we can do, which can indicate just how accurate the mean is. The standard deviation is a measurement that will tell you this. To quote a popular statistics website3 The standard deviation is a statistic that tells you how tightly all the various examples are clustered around the mean in a set of data. When the examples are pretty tightly bunched together and the bell-shaped curve is steep, the standard deviation is small. When the examples are spread apart and the bell curve is relatively flat, that tells you, that you have a relatively large standard deviation.