Transcription of OMMON ESCRIPTIVE TATISTICS C THREE
1 COMMON DESCRIPTIVE STATISTICS / 13 CHAPTER THREE COMMON DESCRIPTIVE STATISTICS The analysis of data begins with descriptive statistics such as the mean, median , mode, range, standard deviation, variance, standard error of the mean, and confidence intervals. These statistics are used to summarize data and provide information about the sample from which the data were drawn and the accuracy with which the sample represents the population of interest. The mean, median , and mode are measurements of the central tendency of the data. The range, standard deviation, variance, standard error of the mean, and confidence intervals provide information about the dispersion or variability of the data about the measurements of central tendency. MEASUREMENTS OF CENTRAL TENDENCY The appropriateness of using the mean, median , or mode in data analysis is dependent upon the nature of the data set and its distribution (normal vs non-normal).
2 The mean (denoted by x) is calculated by dividing the sum of the individual data points (where equals sum of ) by the number of observations (denoted by n). It is the arithmetic average of the observations and is used to describe the center of a data set. mean=x=xn The mean is commonly used to describe numerical data that is normally distributed. It is very sensitive to extreme values in the data set. For example, the mean of the data set {1,2,3,4,5} is 15/5 or 3. If the number 20 is substituted for the 5, the data set becomes {1,2,3,4,20} and the mean is 30/5 or 6. Whereas a mean of 3 accurately describes the center of the first data set, a mean of 6 does not accurately describe the distribution of the second data set. Thus, the mean is subject to extreme values or outliers and may not accurately represent the true center of the data if such outlying values are present.
3 The mean is only appropriate if the data are normally distributed as is the case in the first data set. The median is another method of describing the center of a data set. It is the middle value of the data if the number of observations, n, is odd, or the average of the two middle values if n is even. By definition, half of the data points reside above the median and half reside below the median . For example, the median for each of the above data sets is 3 despite the outlying value of 20 in the second data set. The median is therefore useful for describing the center of a data set that is non-normally distributed as is the case in the second data set. It is also commonly used with ordinal data that is non-numerical. The mode is the value which occurs most frequently in the data. There may be one or more modes for each data set and this makes the mode a useful method for describing a population that is bimodal.
4 In the data set {2,3,4,4,5,6,7,7,8,9}, for example, there are two modes, 4 and 7. Whereas a data set may have one or more modes, there can only be one mean and one median . The mean, median , and mode can be used to evaluate the symmetry of a data distribution. This is essential to choosing the appropriate statistical test. If the mean and median are equal, the data is usually symmetrical or normally distributed and a test for normally distributed data should be used. If the mean and median differ markedly, the data are likely skewed and a test for non-normally distributed data is appropriate. MEASUREMENTS OF VARIABILITY As we have seen, the mean, median , and mode are used to describe the central tendency of the data. Used alone, however, they do not adequately describe a data set. We also need a way of accurately describing the dispersion or variability of the data about the measurements of central tendency.
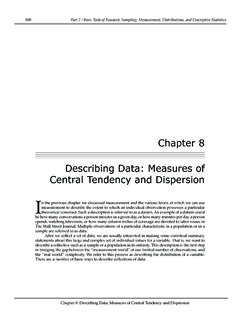
5 Remember that it is this variability that mandates the use of statistical analysis. One method of describing this variability is the range which is defined as the difference between the smallest and largest values in the data set. It is frequently given as the minimum and maximum values and is used to demonstrate the presence of extreme values or outliers which would tend to skew the mean and median in one direction or another. 14 / A PRACTICAL GUIDE TO BIOSTATISTICS Perhaps the most commonly used method to describe the variability of a data set is the standard deviation. It is the cornerstone behind most of the commonly used statistical tests. The standard deviation is an estimate of the average distance of the values from their mean. Assuming the data is normally distributed ( , assumes a bell-shaped curve with half of the data lying on either side of the mean), approximately 68% of the data will lie within 1 standard deviation, approximately 95% within 2 standard deviations, and approximately 99% within 3 standard deviations.
6 X-2sd x-1sd x x+1sd x+2sd 68% 95% 99% Figure 3-1: The Normal Distribution The standard deviation is easily calculated by virtually any computer, but the equation is included below as we will use it repeatedly in describing the commonly used statistical tests for data analysis. The variance is the square of the standard deviation. ()()standard deviation= sd =x-xn12 where x = each data point, x = mean, and n = number of observations Assume we wish to calculate the mean and standard deviation for a series of serum sodium measurements to determine their central tendency and variability.
7 Such calculations are the basis for the normal laboratory ranges which we use everyday. The normal range for most laboratory tests is defined as the mean 2 standard deviations, which encompasses the test results for 95% of the population. Although easily calculated with a computer, creation of a table such as the one below illustrates the steps involved in calculating the standard deviation. Serum Na (x) (x-x) (x-x)2 138 -2 4 137 -3 9 143 3 9 141 1 1 138 -2 4 142 2 4 136 -4 16
8 140 0 0 145 5 25 143 3 9 mean = x = 140 sum = 81 standard deviation= sd =81993== In describing this data, we would state that the mean is 140 mEq/L with a standard deviation of 3 and variance of 9, and that 95% of the values are within 6 mEq of the mean (2 standard deviations). This is similar to the normal clinical range for serum sodium (135-145 mEq/L). COMMON DESCRIPTIVE STATISTICS / 15 The mean, standard deviation, and variance are inappropriate if the data contain significant outliers or are skewed ( , non-normally distributed). In such a situation, the median and range may more accurately describe the central tendency and dispersion of the data set.
9 Charts and other graphics can similarly be used to describe data where the variability is notable. STANDARD ERROR OF THE MEAN The standard error of the mean (se) is frequently confused with the standard deviation. Whereas the standard deviation describes the variability of the data about the mean, the standard error of the mean estimates how closely the sample mean approximates the population mean. It is essentially the standard deviation of all possible sample means if we were to repeatedly draw samples from our population and calculate the mean for a particular variable of interest in each sample. It is calculated by dividing the standard deviation by the square root of n, the number of observations, and will always be smaller than the standard deviation. sd= sen As the sample size (n) increases and approaches the population size, the standard error of the mean approaches zero as the sample mean will more closely approximate the true population mean.
10 The standard deviation, however, remains fairly constant with changes in sample size as the sample standard deviation is an estimate of the population standard deviation whereas the standard error of the mean is not. The standard error of the mean is useful in comparing the means of two samples to determine whether they are representative of the same population. It does not describe the variability of the data, as does the standard deviation, and should not be used in place of the standard deviation. The mean and standard deviation allow the clinician to apply the data to individual patients. The standard error of the mean describes only the sample as a group and cannot be applied to patients clinically. The following example illustrates the use of descriptive statistics in the reporting of data. The Preoperative Evaluation study compared surgical patients who had pulmonary artery catheters placed preoperatively in an intensive care unit ( study patients ) with those who had catheters placed in the operating room prior to their operation ( control patients ).