Transcription of Introduction to Alloy Phase Diagrams - ASM International
1 Section 1 Introduction to Alloy Phase Diagrams Hugh Baker, Editor Alloy Phase Diagrams are useful to metallurgists, materials engineers, and materials scientists in four major areas: (1) development of new alloys for specific applications, (2) fabrica- tion of these alloys into useful configurations, (3) design and control of heat treatment procedures for specific alloys that will produce the required mechanical, physical, and chemical properties, and (4) solving problems that arise with specific alloys in their performance in commercial appli- cations, thus improving product predictability. In all these areas, the use of Phase Diagrams allows research, development, and production to be done more efficiently and cost effectively. In the area of Alloy development, Phase dia- grams have proved invaluable for tailoring exist- ing alloys to avoid overdesign in current applica- tions, designing improved alloys for existing and new applications, designing special alloys for special applications, and developing alternative alloys or alloys with substitute alloying elements to replace those containing scarce, expensive, hazardous, or "critical" alloying elements.
2 Appli- cation of Alloy Phase Diagrams in processing in- cludes their use to select proper parameters for working ingots, blooms, and billets, fmding causes and cures for microporosity and cracks in castings and welds, controlling solution heat treating to prevent damage caused by incipient melting, and developing new processing technol- ogy. In the area of performance, Phase Diagrams give an indication of which phases are thermodynami- cally stable in an Alloy and can be expected to be present over a long time when the part is subjected to a particular temperature ( , in an automotive Ill (a) (b) (c) Fig. I Mechanical equilibria: (a) Stable. (b) Metas- table. (c) Unstable exhaust system). Phase Diagrams also are con- sulted when attacking service problems such as pitting and intergranular corrosion, hydrogen damage, and hot corrosion. In a majority of the more widely used commer- cial alloys, the allowable composition range en- compasses only a small portion of the relevant Phase diagram.
3 The nonequilibrium conditions that are usually encountered inpractice, however, necessitate the knowledge of a much greater por- tion of the diagram. Therefore, a thorough under- standing of Alloy Phase Diagrams in general and their practical use will prove to be of great help to a metallurgist expected to solve problems in any of the areas mentioned above. Common Terms Before the subject of Alloy Phase Diagrams is discussed in detail, several of the commonly used terms will be discussed. Phases. All materials exist in gaseous, liquid, or solid form (usually referred to as a Phase ), de- pending on the conditions of state. State variables include composition, temperature, pressure, mag- netic field, electrostatic field, gravitational field, and so on. The term " Phase " refers to that region of space occupied by a physically homogeneous material. However, there are two uses of the term: the strict sense normally used by physical scien- tists and the somewhat looser sense normally used by materials engineers.
4 In the strictest sense, homogeneous means that the physical properties throughout the region of space occupied by the Phase are absolutely iden- tical, and any change in condition of state, no matter how small, will result in a different Phase . For example, a sample of solid metal with an apparently homogeneous appearance is not truly a single- Phase material, because the pressure con- dition varies in the sample due to its own weight in the gravitational field. In a Phase diagram, however, each single- Phase field ( Phase fields are discussed in a following section) is usually given a single label, and engi- neers often find it convenient to use this label to refer to all the materials lying within the field, regardless of how much the physical properties of the materials continuously change from one part of the field to another. This means that in en- gineering practice, the distinction between the terms " Phase " and " Phase field" is seldom made, and all materials having the same Phase name are referred to as the same Phase .
5 Equilibrium. There are three types of equili- bria: stable, metastable, and unstable. These three conditions are illustrated in a mechanical sense in Fig. l. Stable equilibrium exists when the object is in its lowest energy condition; metastable equi- librium exists when additional energy must be introduced before the object can reach true stabil- ity; unstable equilibrium exists when no addi- tional energy is needed before reaching meta- stability or stability. Although true stable equilib- rium conditions seldom exist in metal objects, the study of equilibrium systems is extremely valu- able, because it constitutes a limiting condition from which actual conditions can be estimated. Polymorphism. The structure of solid elements and compounds under stable equilibrium condi- tions is crystalline, and the crystal structure of each is unique. Some elements and compounds, however, are polymorphic (multishaped); that is, their structure transforms from one crystal struc- ture to another with changes in temperature and pressure, each unique structure constituting a dis- tinctively separate Phase .
6 The term allotropy (ex- isting in another form) is usually used to describe polymorphic changes in chemical elements. Crystal structure of metals and alloys is discussed in a later section of this Introduction ; the allo- tropic transformations of the elements are listed in the Appendix to this Volume. Metastable Phases. Under some conditions, metastable crystal structures can form instead of stable structures. Rapid freezing is a common method of producing metastable structures, but some (such as Fe3C, or"cementite") are produced at moderately slow cooling rates. With extremely rapid freezing, even thermodynamically unstable structures (such as amorphous metal "glasses") can be produced. Systems. A physical system consists of a sub- stance (or a group of substances) that is isolated from its surroundings, a concept used to facilitate study of the effects of conditions of state. "Iso- lated" means that there is no interchange of mass between the substance and its surroundings: The substances in Alloy systems, for example, might be two metals, such as copper and zinc; a metal and a nonmetal, such as iron and carbon; a metal and an intermetallic compound, such as iron and cementite; or several metals, such as aluminum, ASM Handbook, Volume 3: Alloy Phase Diagrams Hugh Baker, editor, p Copyright 1992 ASM International All rights reserved.
7 1*2/ Introduction to Alloy Phase Diagrams magnesium, and manganese. These substances constitute the components comprising the system and should not be confused with the various phases found within the system. A system, how- ever, also can consist of a single component, such as an element or compound. Phase Diagrams . In order to record and visual- ize the results of studying the effects of state variables on a system, Diagrams were devised to show the relationships between the various phases that appear within the system under equi- librium conditions. As such, the Diagrams are variously called constitutional Diagrams , equilib- rium Diagrams , or Phase Diagrams . A single- component Phase diagram can be simply a one- or two-dimensional plot showing the Phase changes in the substance as temperature and/or pressure change. Most Diagrams , however, are two- or three-dimensional plots describing the Phase relationships in systems made up of two or more components, and these usually contain fields (areas) consisting of mixed- Phase fields, as well as single- Phase fields.
8 The plotting schemes in common use are described in greater detail in subsequent sections of this Introduction . System Components. Phase Diagrams and the systems they describe are often classified and named for the number (in Latin) of components in the system: Number of Name of components system or diagrum One Unary Two Binary Three Temary Four Quatemary Five Quinary Six Sexinary Seven Septenary Eight Octanary Nine Nonary Ten Decinary Phase Rule. Thephase rule, first announced by J. Willard Gibbs in 1876, relates the physical state of a mixture to the number of constituents in the system and to its conditions. It was also Gibbs who first called each homogeneous region in a system by the term " Phase ." When pressure and temperature are the state variables, the rule can be written as follows: f=c-p+2 where f is the number of independent variables (called degrees of freedom), c is the number of components, and p is the number of stable phases in the system. Unary Diagrams Invariant Equilibrium.
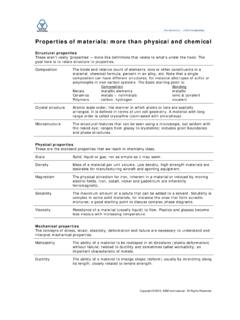
9 According to the Phase rule, three phases can exist in stable equilibrium only at a single point on a unary diagram (f= 1 - 3 + 2 = 0). This limitation is illustrated as point O in the hypothetical unary pressure-temperature (PT) diagram shown in Fig. 2. In this diagram, the three states (or phases)--solid, liquid, and gas--- are represented by the three correspondingly la- I Solid 2 f 4 Liquid / Gas Temperature Fig. 2 Schematic pressure-temperature Phase diagram beled fields. Stable equilibrium between any two phases occurs along their mutual boundary, and invariant equilibrium among all three phases oc- A curs at the so-called triple point, O, where the three boundaries intersect. This point also is Fig. 3 called an invariant point because, at that location on the diagram, all externally controllable factors are fixed (no degrees of freedom). At this point, all three states (phases) are in equilibrium, but any changes in pressure and/or temperature will cause one or two of the states (phases) to disappear.
10 Univariant Equilibrium. The Phase rule says that stable equilibrium between two phases in a unary system allows one degree of freedom (f= 1 - 2 + 2). This condition, called univariant equilibrium or monovariant equilibrium, is illus- trated as lines 1, 2, and 3 separating the single- Phase fields in Fig. 2. Either pressure or tempera- ture may be freely selected, but not both. Once a pressure is selected, there is only one temperature that will satisfy equilibrium conditions, and con- 2 versely. The three curves that issue from the triple 2 2 point are called triple curves: line 1, representing the reaction between the solid and the gas phases, is the sublimation curve; line 2 is the melting curve; and line 3 is the vaporization curve. The vaporization curve ends at point 4, called a criti- cal point, where the physical distinction between the liquid and gas phases disappears. Bivariant Equilibrium. If both the pressure and temperature in a unary system are freely and arbitrarily selected, the situation corresponds to having two degrees of freedom, and the Phase rule says that only one Phase can exit in stable equi- librium (p = 1 - 2 + 2).