Transcription of Introduction To Spacetime Diagrams
1 1 Introduction to Spacetime Diagrams in Special Relativity R. Henning, S. Jeglinski, D. Morse, A Oldenburg In his original paper in 1905, Einstein used several thought ( gedanken ) experiments to illustrate the implications of the constancy of the speed of light. Other physicists found that it was easier to visualize the concepts of relativity and developed a variety of graphing techniques. We will use a simple graphing technique called a Minkowski Spacetime diagram, or simply a Spacetime diagram, to illustrate and understand complex scenarios in special relativity. This diagram was originally developed by Hermann Minkowski in 1908 and is useful for objects that move at a substantial fraction of the speed of light. Background. We are interested in the dynamics of a system of objects: where objects are and where they are going at any given time ( , position and velocity).
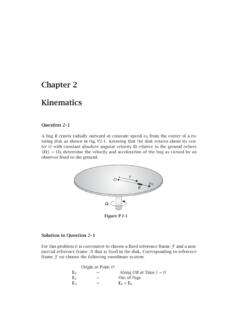
2 Often the best way to visualize the motion of the objects is by making a plot of distance vs time. Consider the following two scenarios: i. Tom throws a red ball with a horizontal (x) component of velocity of 3 m/s at the same time as he starts a stopwatch. ii. Tom notices1 a green firecracker explode at x = 1 m and at t = 2 s after he starts his stopwatch. These two scenarios can be described on a plot of x vs t (right). The coordinate system can be described as Tom s rest, or reference, frame. Tom considers himself to be at rest in his own frame, but nothing is otherwise known about how Tom may be moving with respect to another frame. Conceptual Questions to Ponder (see answers at the end): What is the physical significance of the origin in the plot? How would Tom s location at various times on the plot be represented?
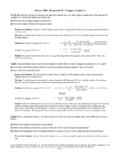
3 1 The meaning of the word notice seems unambiguous, but as we will see, this is true only in the classical viewpoint. When we begin speaking about special relativity later in the document, we will distinguish the difference between the time a person sees (notices) the results of an event, and the location and time of the event itself. 2 Let s now assume Tom sees his good friend Sarah cruising down the road at 2 m/s towards him She is moving along his x-axis and the red ball he threw is on a collision course with her. As it happens, Sarah is 6 m away from Tom when he throws the ball, and it takes her one second to react after he has thrown the red ball, at which time she starts her own stopwatch. What does the above distance vs time plot look like from Sarah s frame of reference? Before we answer this question, it will help to superimpose Sarah s motion onto Tom s plot: From Tom s perspective, Sarah (blue) is moving at 2 m/s as the red ball he threw moves in her direction at +3 m/s.
4 From simple constant-acceleration kinematics , we find that the red ball meets Sarah at (t = s, x = m) in Tom s reference frame. Sarah continues to approach and reaches Tom s location at t = 3 s. In contrast, Sarah considers herself to be at rest. She sees Tom moving in her direction at 2 m/s and the red ball moving in her direction at 2+3=5 m/s. To prove this result mathematically, we note a connection to the relative motion vector equation: It is traditional to distinguish the two reference frames by labeling one with primes; Tom s reference frame is referred to as S, and Sarah s as S'. Assign the red ball to subscript 1, and subscripts 2 and 3 to the respective reference frames. Then, We can now think about drawing Sarah s plot, but we need more information to lock it down: Tom s time zero is one second before Sarah s time zero.
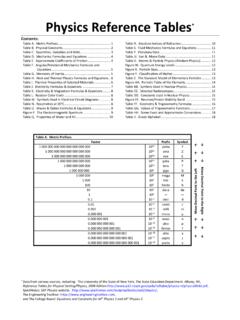
5 This means that the numbers on Sarah s stopwatch lag the same numbers on Tom s stopwatch. To properly locate this relationship on Sarah s plot, we note that the red ball is 1 m away from her when she starts her stopwatch. Using the same constant-acceleration kinematics as in Tom s case, we find that the red ball meets Sarah at (t' = s, x' = 0 m) in Sarah s coordinate system. v13= v12+ v23 v1S= v1S'+ vS'S +3 m/s = v1S' + ( 2 m/s) v1S'= +5 m/s3 To complete the picture, Sarah notices the firecracker at t' = 1 s, as opposed to Tom s t = 2 s (because she started her stopwatch later). The firecracker is 1 m in front of Tom and thus 5 m in front of Sarah when he throws the red ball, but it doesn t explode until 2 s after. During this time, Sarah has moved 4 m in Tom s direction. The firecracker is therefore at her 1 m mark according to Sarah. The final result from Sarah s frame of reference is shown to the right.
6 In this case, the blue trajectory is Tom s motion in Sarah s frame. In either reference frame, the 2 m/s value describes the relative speed of the reference frames (vS S). In this example, this relative speed is a closing speed. Notice that the same red ball appears to have different speeds in each reference frame, because Tom and Sarah are moving with respect to each other. Sarah s plot depicts exactly the same occurrences as Tom s plot. These occurrences are what we will soon call events. The conversion of the description from one reference frame (Tom s) to another (Sarah s) is known as a Galilean transformation. The following features characterize this transformation: The frames of reference are moving with respect to each other at a constant velocity. The position coordinate (x) of an event in one frame will typically have a different position coordinate (x') in another frame.
7 The time coordinate (t) of an event in one frame may have a different time coordinate (t') in another frame, but the passage of time will be the same in both frames ( t = t'). Objects with a velocity in one frame will have a different velocity in another frame. 4 The Galilean Transformation comprised our understanding of relative motion and how measurements compare between frames up until 1905, when Einstein first published his paper on special relativity. In most applications, Galilean transformations remain correct to a very high accuracy; however, one fundamental observational fact, that the speed of light is measured to be the same in all reference frames, forces us to modify the Galilean ideas and gives rise to some very interesting and non-intuitive results when two reference frames are moving relative to one another at speeds significant compared to the speed of light.
8 To begin our own transformation to this new way of thinking, we first introduce some important terminology, and then modify our use of these Galilean kinematics plots to our advantage. Terminology. In the jargon of Spacetime Diagrams , the green point on Tom s and Sarah s plots is an event and the red or blue trajectories are worldlines. An event is anything that can be characterized by a single point on a Spacetime diagram (or on a position vs time graph). An event must have both a time and a place, and specifically refers to where and when the event actually happened within that reference frame. We distinguish this from when an event is seen or noticed seeing or noticing an event is actually a second event with its own time and place. Examples of events include the point in time and space at which Tom threw the red ball, as well as the point and time when the ball collides with Sarah.
9 Yet another event is when and where the firecracker exploded, and still another event is when and where Tom sees the light from the firecracker explosion. All of the events are known to occur by both Tom and Sarah, but each of them will consider the events to have different time and position coordinates in their respective frames. A worldline can be defined as a curve in Spacetime joining the positions of a particle throughout its existence. Each object has its own worldline within a given reference frame. The worldline thus describes the entire history and future of the object. A worldline is composed of an infinite continuum of events ( , the location of the red ball at one time, the location of the red ball an infinitesimal time later, ad infinitum) and describes the motion of an object within that reference frame. Objects moving at a constant speed have straight worldlines.
10 Objects that accelerate have curved worldlines; however, we typically won t consider accelerations in our treatment of special relativity. Building a Spacetime Diagram. Most of the problems we will consider in special relativity only have one relevant position coordinate, which is the direction of relative motion between objects we wish to study. We call this coordinate x and plot it on the horizontal axis. We plot time on the vertical axis. This is reversed compared to what you are used to, but as we work through some examples, you will see that this is sensible for relativistic scenarios. In addition to this reversal, there is one other important difference: time is rescaled by the speed of light; that is, ct (rather than t) is plotted on the vertical axis. As a consequence, the unit of time is replaced by its meter equivalent, so that both 5 axes are measured in the same units.