Transcription of Introduction to the SAS Tutorial
1 SAS Global Forum 2007 Tutorials Paper 207-2007. Introduction to the SAS 9 Business Intelligence Platform: A. Tutorial Greg Nelson ThotWave Technologies, Cary, North Carolina Abstract Business intelligence (BI) is a broad category of application programs and technologies for gathering, storing, analyzing, and providing access to data to help enterprise users make better business decisions. BI. applications support the activities of decision support, query and reporting, online analytical processing (OLAP), statistical analysis, forecasting, and data mining. BI includes a set of concepts and methods to improve business decision making by using fact-based support systems. This Tutorial will guide participants through the landscape of business intelligence and how it has been implemented in SAS 9. We will provide a broad overview of what things we can accomplish with BI, lay the groundwork for continued learning and discuss the tools and technologies and how they interact in some common architectural scenarios.
2 The goal of this presentation will be to get users comfortable with the concepts and vocabulary of BI. We will also provide a demonstration of the capabilities of the SAS suite of BI. tools and summarize which tools are best for the various functions we have to perform using real world examples. Table of Contents ABSTRACT .. 1 Introduction .. 2 DEFINING BI .. 2 HISTORY OF BI .. 2 BI PRODUCT LANDSCAPE .. 2 SAS AND BI .. 4 UNDERSTANDING THE USERS' PERSPECTIVE .. 5 Features and Functions .. 5 SAS BUSINESS INTELLIGENCE FACILITIES .. 6 The BI Architecture .. 6 A GLOSSARY OF SAS BI CLIENTS .. 8 Web Reports .. 9 Stored Processes .. 9 Information Delivery Portal .. 9 BI 10 Enterprise Guide .. 10 Add-in for Microsoft Office .. 10 FUTURE OF BI BUSINESS INTELLIGENCE .. 10 REFERENCES: .. 11 BIOGRAPHY: .. 11 CONTACT INFORMATION: .. 12 1. SAS Global Forum 2007 Tutorials Introduction Business intelligence (BI) is about creating value for our organizations based on data or, more precisely, facts. While it seems like another buzzword to describe what successful entrepreneurs have been doing for years, if not centuries, that is, using business common sense.
3 From a modern business-value perspective, corporations use BI to enhance decision-making capabilities for managerial processes ( , planning, budgeting, controlling, assessing, measuring, and monitoring) and to ensure critical information is exploited in a timely manner. And computer systems are the tools that help us do that better, faster, and with more reliability. Defining BI. Business Intelligence is the art of gaining a business advantage from data by answering fundamental questions, such as how various customers rank, how business is doing now and if continued the current path, what clinical trials should be continued and which should stop having money dumped into! With a strong BI, companies can support decisions with more than just a gut feeling. Creating a fact-based decisioning framework via a strong computer system provides confidence in any decisions made. History of BI. Business intelligence is not just a modern idea. In his famous treatise The Art of War, Sun Tzu says, what enables the wise commander to strike and conquer, and achieve things beyond the reach of ordinary men, is foreknowledge.
4 Now this foreknowledge cannot be elicited from spirits (Giles, 1994). While Sun Tzu is not the father of business intelligence, his concept that foreknowledge breeds success applies directly to BI. Modern BI uses computers to gain foreknowledge by processing and analyzing information in support of business decisions. In the 1980's Executive Information Systems (EIS), in the 1990's, OLAP, followed by scorecards, dashboards, KPIs (key performance indicators), and real time alerts through business activity monitoring. BI was coined by Gartner (Dresner, 1989) as an umbrella term to describe the set of concepts and methods used to improve business decision-making by using fact-based support systems. Regardless of the moniker we give BI, it is certain that it is here to stay. BI Product Landscape Business intelligence is not necessarily about tools and technologies; rather it is a strategy of combining data from various sources with methodologies that make those facts solidify in a cohesive manner.
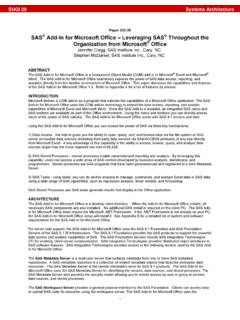
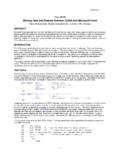
5 The data part of this strategy is data warehousing (see Figure 1). Once the data is sourced, scrubbed, enriched, conformed, and finally housed in access-ready formats BI tools can make the data sing and dance. 2. SAS Global Forum 2007 Tutorials Figure 1. Corporate Information Factory. In Figure 1 above (adapted from Inmon, Imhoff and Sousa, 2002), BI is traditionally found in the Data Delivery area (to the right side of the Information Factory.) Operational BI, on the other hand, is reporting and analysis done directly off of the operational systems or via an Operational Data Store (for example see, Imhoff, 2001.). Traditional BI makes use of past data points (what you know about the data from a historical perspective). and displays it for the end user to make important inferences. The historical reporting takes advantage of the dimensionality in the data to slice and dice by reporting facts along any number of dimensions. Early reporting tools allowed programmers to define exactly what they wanted to present in varying levels of granularity and aggregation.
6 In the 1980's a plethora of OLAP style data structures emerged, which included MOLAP, ROLAP and Hybrid-ROLAP. All of which provided the ability to drill in, around and through to make sense of the data presented. While OLAP is certainly not dead, highly structured interfaces to the data came out of an organization's executive branch interested in the details. In other words, taking data from green bar and simply transferring it to the browser was not enough. Management needed to synthesize the data into meaningful bits of information. Tell me what's wrong. Highlight the facts for me, was the driving force behind the dashboard and scorecards in today's electronic toolbox. Reporting on the past can only show what has happened, not what the future may bring. Past information must be combined with some real-time information and then layered with analytics in order to have true foreknowledge. This is where data mining, forecasting and other predictive analytics play an important role. This also turns out to be a major differentiator for SAS relative to its competitors.
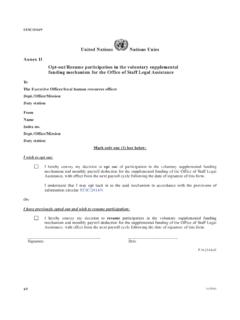
7 3. SAS Global Forum 2007 Tutorials SAS and BI. Having just celebrated 30 years of providing software for decision support, it is safe to say SAS has always done BI. From the early days of helping agricultural universities share statistical algorithms to supporting Fortune 100 companies today, SAS solutions take data and make sense of the patterns and provide flexibility and power in how to display and share information. In SAS software, Business Intelligence includes: A set of client applications designed for a specific type of business or analyst SAS server processes designed to provide specific types of services for the client applications A centralized metadata management facility In the figure below, the Business Intelligence tools are highlighted. SAS DI Studio SAS OLAP SAS AppDev Studio Server (SAS. SAS Data Surveyors SAS Information Application Delivery Portal SAS OLAP Server). Administrator SAS Office SAS Scalable Integration SAS Data Quality Performance Server Data Server SAS Web Report Studio SAS BASE (as a SPDE.)
8 Transformation SAS Enterprise engine) Guide SAS Access SAS Information Map Products Studio SAS Management Console is part of the Manageability cornerstone SAS Workspace Server and SAS Stored Process Server are used by all the Clients Figure 2. SAS Information Value Chain 4. SAS Global Forum 2007 Tutorials SAS BI as a product set comes in two flavors: Business Intelligence and Enterprise Business Intelligence. The table below highlights which products are included in each package. BI Server Enterprise BI Server Base BI Server Components, plus: Graph Information Delivery Portal Integration Technologies OLAP Viewers for Java and .NET. Metadata Server OLAP Cube Studio Information Map Studio Add-in for Microsoft Office Web Report Studio SAS Management Console Query and Reporting Services While the list above is certainly not comprehensive of all of the BI capabilities within SAS, it certainly represents a large portion of what SAS can do to support BI initiatives. Other developer-centric tools, which help support the delivering of information, include SAS/IntrNet and AppDev Studio.
9 Of course the analytic engines that set SAS apart from its competitors include products for data mining, forecasting, quality assurance and statistics. These engines can be plugged into the core BI products to support the specific capability of the BI environment being developed. Understanding the Users' Perspective From a functional perspective, the most common applications for any SAS solution are planning, budgeting, financial consolidation, compliance reporting and forecasting, general data warehouse reporting/. dashboarding, and sales and marketing analysis. SAS can do all of these things using a variety of approaches (pieces and parts of the BI platform). One of the ways to look at all of these tools is by looking at the features and functions of BI offerings in general then map these appropriately to the SAS offerings. FEATURES AND FUNCTIONS. OLAP (On-line analytical processing) refers to the way in which business users can slice and dice their way through data using sophisticated tools that allow for the navigation of dimensions such as time or hierarchies.
10 Usually the display is some numeric measure such as sales dollars.. Query and Reporting being able to ask questions of the data that may not have been asked before. That is, reports constructed to answer novel questions or where the presentation is not yet defined. Once generated, the report (or just the report instructions) can be saved for future viewing. 5. SAS Global Forum 2007 Tutorials Querying usually involves users entering SQL or an English-translation of SQL commands and an immediate execution environment where results can be viewed. Advanced Analytics sometimes referred to as data mining, forecasting or predictive analytics, this takes advantage of statistical analysis techniques to predict or provide certainty measures on facts. Collaborative BI refers to the concept of taking structured data, analysis and/or reports and combining unstructured content (such as comments, discussions, attachments) so that facts can be augmented by additional content. Corporate Performance Management (Portals, Scorecards, Dashboards) this general category usually provides a container for several pieces to plug into so that the aggregate tells a story.