Transcription of iShares Russell 1000 Value ETF
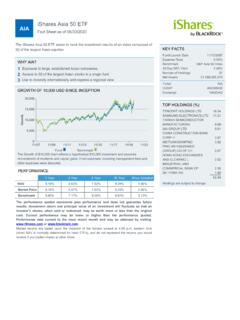
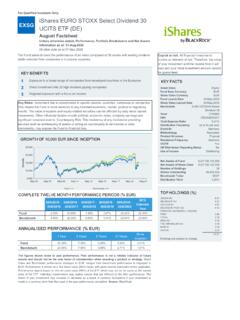
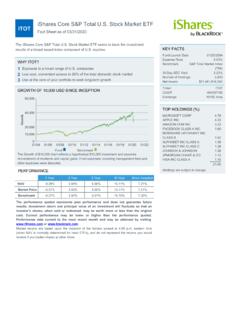
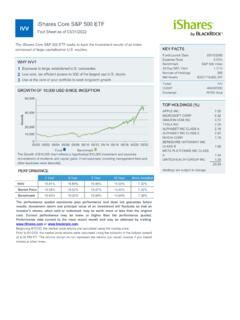
1 iShares Russell 1000 Value ETF. IWD Fact sheet as of 06/30/2021. The iShares Russell 1000 Value ETF seeks to track the investment results of an index composed of large- and mid-capitalization equities that exhibit Value KEY FACTS. characteristics. fund Launch Date 05/22/2000. Expense Ratio Benchmark Russell 1000 Value Index WHY IWD? 30 Day SEC Yield 1 Exposure to companies that are thought to be undervalued by the market Number of Holdings 840. relative to comparable companies Net Assets $53,917,692,948. 2 Targeted access to a specific category of domestic stocks Ticker IWD. CUSIP 464287598. 3 Use to tilt your portfolio towards Value stocks Exchange NYSE Arca GROWTH OF 10,000 USD SINCE INCEPTION. TOP HOLDINGS (%). BERKSHIRE HATHAWAY INC. CLASS B JPMORGAN CHASE & CO JOHNSON & JOHNSON UNITEDHEALTH GROUP INC PROCTER & GAMBLE BANK OF AMERICA CORP WALT DISNEY EXXON MOBIL CORP COMCAST CORP CLASS A VERIZON COMMUNICATIONS.
2 fund Benchmark INC The Growth of $10,000 chart reflects a hypothetical $10,000 investment and assumes reinvestment of dividends and capital gains. fund expenses, including management fees and Holdings are subject to change. other expenses were deducted. PERFORMANCE. 1 Year 3 Year 5 Year 10 Year Since Inception NAV Market Price Benchmark The performance quoted represents past performance and does not guarantee future results. Investment return and principal Value of an investment will fluctuate so that an investor's shares, when sold or redeemed, may be worth more or less than the original cost. Current performance may be lower or higher than the performance quoted. Performance data current to the most recent month end may be obtained by visiting or Beginning 8/10/20, the market price returns are calculated using the closing price.
3 Prior to 8/10/20, the market price returns were calculated using the midpoint of the bid/ask spread at 4:00 PM ET. The returns shown do not represent the returns you would receive if you traded shares at other times. TOP SECTORS (%) FEES AND EXPENSES BREAKDOWN. Financials Expense Ratio Health Care Management Fee Industrials Acquired fund Fees and Expenses information Technology Foreign Taxes and Other Expenses Communication Consumer Staples Consumer Discretionary Energy Utilities Real Estate Materials Cash and/or Derivatives fund CHARACTERISTICS. Beta vs. S&P 500 Standard Deviation (3yrs) Price to Earnings Price to Book Ratio GLOSSARY. Beta is a measure of the tendency of securities to move with the market as a The price to book (P/B) Value ratio is a fundamental measure used to whole.
4 A beta of 1 indicates that the security's price will move with the determine if an investment is valued appropriately. The book Value of a market. A beta less than 1 indicates the security tends to be less volatile company is a measure of how much a company's assets are worth assuming than the market, while a beta greater than 1 indicates the security is more the company's debts are paid off. Each holding's P/B is the latest closing volatile than the market. price divided by the latest fiscal year's book Value per share. Negative book The price to earnings ratio (P/E) is a fundamental measure used to values are excluded from this calculation. For hedged funds, the underlying determine if an investment is valued appropriately. Each holding's P/E is the fund 's Value is shown.
5 Latest closing price divided by the latest fiscal year's earnings per share. Negative P/E ratios are excluded from this calculation. For hedged funds, the underlying fund 's Value is shown. Want to learn more? @ iShares Carefully consider the fund 's investment objectives, risk factors, and charges and expenses before investing. This and other information can be found in the fund 's prospectus, and if available, summary prospectus, which may be obtained by calling 1-800- iShares (1-800-474-2737) or by visiting or Read the prospectus carefully before investing. Investing involves risk, including possible loss of principal. Diversification may not protect against market risk or loss of principal. Shares of ETFs are bought and sold at market price (not NAV) and are not individually redeemed from the fund .
6 Any applicable brokerage commissions will reduce returns. Index returns are for illustrative purposes only. Index performance returns do not reflect any management fees, transaction costs or expenses. Indexes are unmanaged and one cannot invest directly in an index. Past performance does not guarantee future results. "Acquired fund Fees and Expenses" reflect the fund 's pro rata share of the indirect fees and expenses incurred by investing in one or more acquired funds, such as mutual funds, business development companies, or other pooled investment vehicles. AFFE are reflected in the prices of the acquired funds and thus included in the total returns of the fund . The iShares Funds are distributed by BlackRock Investments, LLC (together with its affiliates, "BlackRock").
7 The Russell Index is a trademark of Russell Investment Group and has been licensed for use by BlackRock. The iShares Funds are not sponsored, endorsed, issued, sold or promoted by Russell Investment Group. Nor does this company make any representation regarding the advisability of investing in the Funds. BlackRock is not affiliated with the company listed above. 2021 BlackRock. All rights reserved. iShares , iBONDS and BLACKROCK are registered trademarks of BlackRock Inc, or its subsidiaries. All other marks are the property of their respective owners. FOR MORE information , VISIT OR CALL 1-800 iShares (1-800-474-2737). iS-IWD-F0621. Not FDIC Insured - No Bank Guarantee - May Lose Value 1191297. iShares Russell 1000 Value ETF. IWD. SUSTAINABILITY CHARACTERISTICS.
8 Sustainability Characteristics can help investors integrate non-financial, sustainability considerations into their investment process. These metrics enable investors to evaluate funds based on their environmental, social, and governance (ESG) risks and opportunities. This analysis can provide insight into the effective management and long-term financial prospects of a fund . The metrics below have been provided for transparency and informational purposes only. The existence of an ESG rating is not indicative of how or whether ESG factors will be integrated into a fund . The metrics are based on MSCI ESG fund Ratings and, unless otherwise stated in fund documentation and included within a fund 's investment objective, do not change a fund 's investment objective or constrain the fund 's investable universe, and there is no indication that an ESG or Impact focused investment strategy or exclusionary screens will be adopted by a fund .
9 For more information regarding a fund 's investment strategy, please see the fund 's prospectus. MSCI ESG fund Rating (AAA-CCC) A MSCI ESG Quality Score (0-10) MSCI ESG Quality Score - Peer MSCI ESG % Coverage Percentile MSCI Weighted Average fund Lipper Global Classification Equity US Carbon Intensity (Tons CO2E/. Funds in Peer Group 3,308 $M SALES). All data is from MSCI ESG fund Ratings as of 07-Jul-2021, based on holdings as of 31-May-2021. As such, the fund 's sustainable characteristics may differ from MSCI ESG fund Ratings from time to time. To be included in MSCI ESG fund Ratings, 65% of the fund 's gross weight must come from securities covered by MSCI ESG Research (certain cash positions and other asset types deemed not relevant for ESG analysis by MSCI are removed prior to calculating a fund 's gross weight; the absolute values of short positions are included but treated as uncovered), the fund 's holdings date must be less than one year old, and the fund must have at least ten securities.
10 For newly launched funds, sustainability characteristics are typically available 6 months after launch. ESG GLOSSARY: MSCI ESG fund Rating (AAA-CCC): The MSCI ESG Rating is calculated as a direct mapping of ESG Quality Scores to letter rating categories ( AAA = ). The ESG. Ratings range from leader (AAA, AA), average (A, BBB, BB) to laggard (B, CCC). MSCI ESG Quality Score - Peer Percentile: The fund 's ESG Percentile compared to its Lipper peer group. fund Lipper Global Classification: The fund peer group as defined by the Lipper Global Classification. Funds in Peer Group: The number of funds from the relevant Lipper Global Classification peer group that are also in ESG coverage. MSCI ESG Quality Score (0-10): The MSCI ESG Quality Score (0 - 10) for funds is calculated using the weighted average of the ESG scores of fund holdings.