Transcription of iShares U.S. Infrastructure ETF
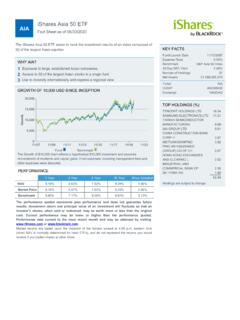
1 IFRAiShares Infrastructure ETFFact Sheet as of 12/31/2022 The iShares Infrastructure ETF seeks to track the investment results of an index composed of equities of companies that have Infrastructure exposure and that could benefit from a potential increase in domestic Infrastructure IFRA?1 Exposure to Infrastructure companies that could benefit from a potential increase in domestic Infrastructure activities2 Access to two groups of Infrastructure companies that are equally weighted: owners and operators, such as railroads and utilities, and enablers, such as materials and construction companies3 Use to express a thematic view on Infrastructure stocksGROWTH OF 10,000 USD SINCE INCEPTIONFund Benchmark The Growth of $10,000 chart reflects a hypothetical $10,000 investment and assumes reinvestment of dividends and capital gains.
2 Fund expenses, including management fees and other expenses were Year3 Year5 Year10 YearSince performance quoted represents past performance and does not guarantee futureresults. Investment return and principal value of an investment will fluctuate so that aninvestor s shares, when sold or redeemed, may be worth more or less than the originalcost. Current performance may be lower or higher than the performance data current to the most recent month end may be obtained by visiting or 8/10/20, the market price returns are calculated using the closing price. Prior to 8/10/20, the market price returns were calculated using the midpoint of the bid/ask spreadat 4:00 PM ET.
3 The returns shown do not represent the returns you would receive if you tradedshares at other FACTSFund Launch Date04/03/2018 Expense FactSet Infrastructure Index30 Day SEC of Holdings156 Net Assets$1,763,928,515 TickerIFRACUSIP46435U713 ExchangeCboe BZX formerly known as BATSTOP HOLDINGS (%)BLK CSH FND TREASURY SL RESOURCES CORP CLASS ENERGY JERSEY INDS GAS are subject to is a measure of the tendency of securities to move with the market as awhole. A beta of 1 indicates that the security s price will move with themarket. A beta less than 1 indicates the security tends to be less volatilethan the market, while a beta greater than 1 indicates the security is morevolatile than the price to earnings ratio (P/E) is a fundamental measure used todetermine if an investment is valued appropriately.
4 Each holding's P/E is thelatest closing price divided by the latest fiscal year's earnings per P/E ratios are excluded from this calculation. For hedged funds, theunderlying fund s value is price to book (P/B) value ratio is a fundamental measure used todetermine if an investment is valued appropriately. The book value of acompany is a measure of how much a company's assets are worth assumingthe company's debts are paid off. Each holding's P/B is the latest closingprice divided by the latest fiscal year's book value per share. Negative bookvalues are excluded from this calculation. For hedged funds, the underlyingfund s value is to learn more?
5 @iSharesCarefully consider the Fund's investment objectives, risk factors, and charges and expenses before investing. This and other information can befound in the Fund's prospectus, and if available, summary prospectus, which may be obtained by calling 1-800- iShares (1-800-474-2737) or byvisiting or Read the prospectus carefully before involves risk, including possible loss of that concentrate investments in specific industries, sectors, markets or asset classes may underperform or be more volatile than other industries,sectors, markets or asset classes and than the general securities may not protect against market risk or loss of principal. Shares of ETFs are bought and sold at market price (not NAV) and are not individuallyredeemed from the fund.
6 Any applicable brokerage commissions will reduce returns are for illustrative purposes only. Index performance returns do not reflect any management fees, transaction costs or are unmanaged and one cannot invest directly in an index. Past performance does not guarantee future results."Acquired Fund Fees and Expenses" reflect the Fund's pro rata share of the indirect fees and expenses incurred by investing in one or more acquired funds,such as mutual funds, business development companies, or other pooled investment vehicles. AFFE are reflected in the prices of the acquired funds andthus included in the total returns of the Fund. The iShares Funds are distributed by BlackRock Investments, LLC (together with its affiliates, "BlackRock").
7 The iShares Funds are not sponsored, endorsed, sold or promoted by ICE Data Services, LLC, nor does this company make any representation regardingthe advisability of investing in the Funds. BlackRock is not affiliated with ICE Data Services, provides compensation in connection with obtaining or using third-party ratings and rankings. 2022 BlackRock. All rights reserved. iShares , iBONDS and BLACKROCK are registered trademarks of BlackRock Inc, or its subsidiaries. All othermarks are the property of their respective MORE INFORMATION, VISIT OR CALL 1-800 iShares (1-800-474-2737)iS-IFRA-F1222 Not FDIC Insured - No Bank Guarantee - May Lose Value2293511 TOP SECTORS (%) and/or CHARACTERISTICSBeta vs.
8 S&P 500 (3y) Deviation (3yrs) to to Book AND EXPENSES BREAKDOWNE xpense Fund Fees and Taxes and Other information contained herein (the Information ) has been provided by MSCI ESG Research LLC, a RIA under the Investment Advisers Act of 1940, andmay include data from its affiliates (including MSCI Inc. and its subsidiaries ( MSCI )), or third party suppliers (each an Information Provider ), and it may not bereproduced or redisseminated in whole or in part without prior written permission. The Information has not been submitted to, nor received approval from, the USSEC or any other regulatory body. The Information may not be used to create any derivative works, or in connection with, nor does it constitute, an offer to buy orsell, or a promotion or recommendation of, any security, financial instrument or product or trading strategy, nor should it be taken as an indication or guarantee ofany future performance, analysis, forecast or prediction.
9 Some funds may be based on or linked to MSCI indexes, and MSCI may be compensated based on thefund s assets under management or other measures. MSCI has established an information barrier between equity index research and certain Information. Noneof the Information in and of itself can be used to determine which securities to buy or sell or when to buy or sell them. The Information is provided as is and theuser of the Information assumes the entire risk of any use it may make or permit to be made of the Information. Neither MSCI ESG Research nor any InformationParty makes any representations or express or implied warranties (which are expressly disclaimed), nor shall they incur liability for any errors or omissions in theInformation, or for any damages related thereto.
10 The foregoing shall not exclude or limit any liability that may not by applicable law be excluded or Infrastructure ETFSUSTAINABILITY CHARACTERISTICSS ustainability Characteristics provide investors with specific non-traditional metrics. Alongside other metrics and information, these enable investors to evaluate funds on certain environmental, social and governance characteristics. Sustainability Characteristics do not provide an indication of current or future performance nor do they represent the potential risk and reward profile of a fund. They are provided for transparency and for information purposes only. Sustainability Characteristics should not be considered solely or in isolation, but instead are one type of information that investors may wish to consider when assessing a fund does not seek to follow a sustainable, impact or ESG investment strategy.