Transcription of ISSN 1757- 5958 - The Royal Society of Chemistry
1 issn 1757- 5958 amc technical briefs recommendation Editor: Michael Thompson Analytical Methods Committee AMCTB 26A Re-issued September 2008 amc Measurement uncertainty and confidence intervals near natural limits Analytical chemists often measure quantities close to the limits of the range in which the true value could possibly fall - the 'possible range'. Examples include measuring the purity of a material that is almost 100% pure, or measuring analytes that are present at concentrations close to zero. In such work, the usual expanded uncertainty interval (x U) often extends beyond the possible range.
2 Sometimes even individual measurements may lie out of that range. It is then unclear how best to report the result and associated uncertainty interval. There is a simple and statistically justifiable procedure for dealing with this situation when a statement about the true concentration of the analyte is required. The problem of natural limits For most chemical measurement, there are natural limits to the range in which the true value could possibly fall, the most obvious being that an analyte cannot be present at levels of above 100% or below zero. In alternative notation, this is a possible range of [0, 1]. (There may be other factors that reduce the possible range further, but for the present discussion we will assume that [0, 1] expresses the possible range.)
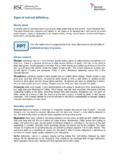
3 When both limits of an expanded uncertainty interval are within the possible range, the classical confidence interval is symmetric and performs well in terms of coverage. However, if the interval is large because of large experimental uncertainty or few degrees of freedom, one of the limits may be out of the possible range, implying that the true value could be in the out-of-range region. )b)c)Measured value Figure 1. Confidence intervals ( ) obtained from a set of five replicate measurements ( ). (a) The raw observations. (b) Confidence interval for the population mean. (c) Confidence interval for the true concentration of analyte. (Units are arbitrary). The vertical dotted line at is the mean of the observations.
4 Figure 1a illustrates such a situation. All five replicate measurements are above zero, but the low number of degrees of freedom and large uncertainty conspire to produce a 95%confidence interval (Figure 1b) with a lower limit of Figure 1b is the correct confidence interval for the true mean of the population of possible observations. But the true analyte concentration cannot be below zero; Figure 1b is not the correct confidence interval for the true analyte concentration. Reporting the symmetric range would not be consistent with the strict definition of expanded uncertainty. Rather more importantly, this instance presents a problem to the analyst if asked to provide an inference about the true analyte concentration: the expanded uncertainty should not contain a region in which the true value could not possibly lie.
5 So how should we report a confidence interval for the true analyte concentration which is consistent with the possible range of [0, 1]? Measurement uncertainty a reminder In general, a measurement result should have an estimate of the uncertainty associated with it. The ISO Guide to the Expression of Uncertainty in Measurement (GUM) is the standard reference on the subject; guidance specific to analytical Chemistry is available from Eurachem (see further reading ). A standard uncertainty usually has to be converted into an 'expanded' uncertainty interval, which, for most practical purposes, can be regarded as a range expected to include the true value ( value of the measurand in the ISO Guide) with high probability.
6 The resulting interval cis obtained kux measfrom the measured value xmeas and combined standard uncertainty uc via a coverage factor k, which usually has a value between 2 and 3 to provide 95% confidence. The expanded uncertainty is the same as the classical confidence interval for the population mean when the uncertainty is dominated by the spread of replicate measurements. In that case, the coverage factor is the t-value for the desired confidence level and the number of degrees of freedom associated with the combined standard uncertainty. Dealing with out-of-range uncertainty intervals The desired outcome is an expanded uncertainty interval which satisfies three requirements: 1. An interval that lies within the possible range.
7 2. A coverage close to the specified confidence level, so that a claimed 95% expanded uncertainty should be expected to contain the true value 95% of the time. 3. Reported results that have minimal bias in the long term. If the expanded uncertainty has been calculated using classical statistics, the interval including any part lying outside the possible range will have 95% coverage. However, since the true value cannot lie outside the possible range, it is possible to simply truncate this interval at the edge of the possible range and yet retain the required 95% coverage. This truncated classical confidence interval is the only interval that has this property exactly and is simple to implement using existing TBRec 26A 19/09/2008 Royal Society of Chemistry 2008 tools.
8 Where the mean observation is also out of range, and we require the interval for the true concentration, the reported result should simply be shifted to the relevant limit (0 or 100%). Shifting to the limit does, however, lead to a small long-term bias, which may well be unacceptable to customers (or PT providers) demanding raw data for their own statistical analysis. These customers will continue to require the raw observations regardless of natural limits. Nonetheless, simple truncation at zero can be shown to provide minimal bias among the range of options so far examined for this situation. If this procedure is followed, the expanded uncertainty interval becomes progressively more asymmetric as the result approaches the limit.
9 Figure 2 illustrates the situation near zero, where the measured mean is reported until it hits zero, and is thereafter shifted to zero. valueExpanded uncertainty Figure 2. Truncating classical confidence intervals close to zero. The mean varies between and , and the standard deviation is fixed at The solid, partial bars show the reported uncertainty interval. Eventually, the classical interval falls entirely beyond the natural limit, implying an adjusted interval of [0, 0]. This tells us that the results are inconsistent with any possible true concentration. The analyst should return to the original data and determine the cause. If this is impractical, or no cause can be found, the only recourse consistent with reporting an estimated true analyte concentration is to quote a value of zero with a large uncertainty.
10 Preliminary studies suggest that a Bayesian maximum density interval based on the truncated t-distribution may be appropriate here. Unfortunately, this interval is not straightforward to calculate with ordinary analytical software or tables and has yet to be investigated fully for analytical Chemistry applications. In the mean time, a conservative professional judgement is indicated; for example, basing the interval on a coverage factor of at least 3 instead of 2 provides a more conservative interval. Note: never truncate or censor results that will be used in subsequent calculations or statistical analysis. Only truncate or adjust results to provide the final inference drawn from the observations. Recommendation 1.