Transcription of Jan-2018 - CEA
1 Government Of IndiaMinistry of PowerCentral Electricity AuthorityNew DelhiPower SectorJan- 2018 SNSection A - Highlights of Power SectorPage1 Electricity Generation for Jan 2018 (BU)1A & 1B2 Generating Capacity Addition for Jan 2018 (MW)23 List of Projects Commissioned in Jan 201834 All India Installed Capacity (MW) Region-wise as on India Installed Capacity (MW) Sector-wise as on Lines Added during Jan 2018 (Ckms)57 Transformation Capacity Addition during Jan 2018 (MVA)68 Power Supply Position (Energy & Peak) in Jan 201879 Peak Shortage of Power Supply (MW) in Different Regions 8-910 All India PLF Sector-wise for Jan 20181011T & D and AT & C Losses (%)12 All India Village Electrification & Pumpsets Energised as on cost of Power & Average Realisation All India per capita consumption of Electricity (KWh)15 All India Coal consumption for Power Generation (MT)
2 1 Capacity Addition Targets and Achievements in 12th Plan122 Capacity Addition Targets & Achievements during Jan 2018133 Installed Capacity in various Regions including their and Achievements of Transmission Lines in Jan 2018 2 List of Transmission Lines Commissioned/Ready for commissioning during Jan 20181 Programme and Achievements of Sub-Stations in Jan 20182 List of Sub Stations commissioned/ready for commisssioning during Jan 20181 Electricity Generation (MU) Targets and Achievements for 2016-17 221 Power Supply Position (Provisional) for Jan 2018232 Peak Demand and Peak Met (Provisional) for Jan 2018243 Power Supply Position (Revised) for Dec 2017254 Peak Demand and Peak Met (Revised) for Dec 2017265 Notified Power cuts / Restrictions on Industries during Jan 2018276 Power Supply to Agricultural Sector during Jan 2018281 Growth of Installed Capacity since 6th Plan292 Growth of Transmission Sector since 6th Plan303 All India Yearly Coal consumption for Power Generation (Utilities)4 All India Annual Per Capita Consumption of Electricity since 20065 Average cost of power supply & Average realisation (Paisa/kwh)
3 6 Growth of Rural Electrification & Pump Sets Energisation7 Status of Hydro Schemes Cleared by the CEA upto Jan 20181 Rate of sale of power for the year 2014-201533-41 Section H - Rate of sale of power for the year 2015-2016 Executive Summary for the Month of Jan 20183211202131 Section B - Capacity Addition Section C - Transmission Lines Section D - Sub StationsSection E - Electricity GenerationSection F - Power supply positionContentsSection G - Growth of Power SectorSNContentsPage1 Electricity Generation (Conventional Sources) for Jan 2018 (BU)12 Generating Capacity Addition for Jan 2018 (MW)23 List of Projects Commissioned in Jan 201834 All India Installed Capacity (MW) Region-wise as on India Installed Capacity (MW) Sector-wise as on Lines Added during Jan 2018 (Ckms)57 Transformation Capacity Addition during Dec 2017 (MVA)68 Power Supply Position (Energy & Peak) in Jan 201879 Peak Shortage of Power Supply (MW) in Different Regions 8-910 All India PLF Sector-wise for Jan 20181011T & D and AT & C Losses (%)12 All India Village Electrification & Pumpsets Energised as on cost of Power & Average Realisation#14 All India per capita consumption of Electricity (KWh)
4 15 All India Coal consumption for Power Generation (MT) Section A - Highlights of Power #TypeThermalHydroNuclearBhutan ImportAll Jan'17 Jan' Change Electricity Generation During April 2017 to Jan 2018 & April 2017 to Jan 2018 (BU) Electricity Generation for Jan, 2018 (BU)Jan-18 TypeAchievementJan-17 Targets% Change Jan'17 Jan'18 MonthGeneration from Conventional SourcesGeneration from Renewable SourcesTotal Generation from Conventional SourcesGeneration from Renewable SourcesTotal Growth in Conventional GenerationGrowth in Renewable GenerationGrowth in Total Generation(MU)(MU)(MU)(MU)(MU)(MU)(%)(%) (%)
5 Apr-17103,1606,932110,09299,3455,082104, ,2958,666115,96199,9036,820106, ,52510,228107,75397,3268,118105, ,91212,928110,84096,4429,554105, ,60610,857105,46395,2379,571104, ,0727,516105,58895,7418,279104, ,6186,564109,18299,7796,274106, ,6056,894102,49993,5685,03098, ,0208,122105,14295,2515,463100, SolarBiomassBagasseSmall Generation From Renewable (source wise)April- Dec, 2017 vis- -vis April- Dec, 2016 Electricity Generation (Conventional & Renewable Sources)April, 2017- Dec, 2017 vis- -vis April, 2016- Dec, 2016 All Figure in MUSource-Wise All India Generation from RenwablesFor the Month ofCommulative value for the periodDec, 2017 Dec, 2016 Dec, 2017 Dec ,2016 Generation (April, 2016- Dec, 2016)Generation (April, 2017- Dec, 2017)% -16 to Apr -17 to Jan-18% Generating Capacity Addition for Jan, 2018 (MW)Generating Capacity Addition during April '16 to Jan' 17 & April '17 to Jan' 18 (MW)% Change 2018 TypeJan-181, -16 to Apr -17 to Jan-18(i) Thermal(ii)(iii)NuclearHydroRESG rand.
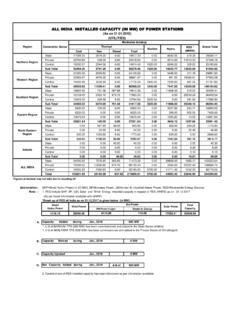
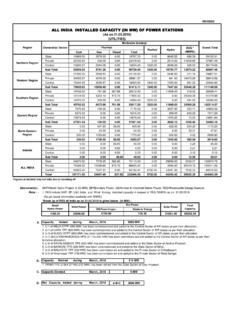
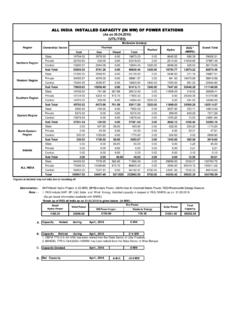
6 Captive Genaration is not included in the total. RES as on List of Projects Commissioned During Jan 20184. All India Installed Capacity (MW) Region-wise as on TPP Unit- 2,3 (600 MW) was Commissioned on Extn Unit -8 (250 MW) was Commissioned on = All India Installed Capacity (MW) Sector-wise as on TotalTHERMALN uclearHydroRESRES as on , , 31%Private, , 44%Central, , 25%All India Installed Capacity(MW) as on 31-1- 2018 (Sector-Wise)Voltage Level+/- 500 KV HVDC+/- 800 KV HVDC765 KV400 KV220 KVAll IndiaVoltage Level+/- 500 KV HVDC+/- 800 KV HVDC765 KV400 KV220 KVAll India5006. Transmission Lines Added during Jan, 2018 (Ckms)Jan-17 Jan-1800001601438535522761506811 Transmission Lines Added during Apr '16 to Jan '17 & Apr '16 to Jan'18 (Ckms)Apr '15 - Dec'16 Apr '16 - Jan '184523345522076170472574057053038927410 55422076170470500010000150002000025000ck ms Apr '16 to Jan17 Apr '17 to Jan 181506811020040060080010001200140016001c kmsJan'17 Jan'18 Voltage Level+/- 800 KV HVDC+/- 500 KV HVDC765 KV400 KV220 KVAll IndiaVoltage Level+/- 800 KV HVDC+/- 500 KV HVDC765 KV400 KV220 KVAll India67.
7 Transformation Capacity Addition During Jan, 2018 (MVA)025002795195500 Jan-17 Jan-18725001500210026034015003000 All India Transformation Capacity Addition during Apr '16 to Jan'17 & Apr '17 to Jan'18 (MVA)65865020500306051176054785190002186 0124250 April' 16 to Jan '17 April '17 to Jan '187250210001000200030004000500060007000 8000 MVAT ransformation Capacity Addition during Jan 2018 Jan-17 Jan-1854785658650745201 MVAA pril' 16 to Jan '17 April '17 to Jan '18 Jan'17 Jan 18 Jan '17 Jan' '17 Northern 2684628,9962637328, 2870732,1582869732, ,6422553127, 1015810,1151003310, Eastern 12891,29612751, India92531100,2089190999, 17 Jan 18 Jan 17 Jan '17 Northern Eastern Power Supply Position (Energy & Peak) in Dec.
8 2017 Peak DemandPeak MetRequirementAvailabilityEnergy (MU)RegionDeficit (%)Deficit (%)RegionPower (MW)ChandigarhDelhiHaryanaHPJ&KPunjabRaj asthanUPUtrakhandJan '170000535050000 Jan '18000058001581150 ChattisgarhGujaratMPMaharastraDaman & DiuDadar Nagar HaveliJan '17197140150050 Jan '1821610338001 APTelenganaKarnatakaKeralaTamil NaduPuducherryLakshyadeepJan'17516470200 0 Jan '171335116450089. Peak Shortage of Power Supply (MW) in Different Regions000058001581150000053505000004008 00 ChandigarhDelhiHaryanaHPJ&KPunjabRajasth anUPUtrakhandMWNorthern States (MW)Jan '18 Jan '17216103380011971401500500500 ChattisgarhGujaratMPMaharastraDaman &DiuDadarNagarHaveliMWWestern States (MW)Jan '18 Jan '17133511645005164702000050 APTelenganaKarnatakaKeralaTamil NaduPuducherryLakshyadeepSouthern State (MW)
9 Jan '17 Jan'17 BiharDVCJ harkhandOdishaWest BengalSikkimA&N IslandJan'171090002608 Jan '180000004 ArunachalAssamManipurMeghalayaMizoramNag alandTripuraJan '172100011 Jan '18429709280900000041090002608050100150 BiharDVCJ harkhandOdishaWestBengalSikkimA&NIslandM WEastern States (MW)Jan '18 Jan'17429709280200011050 ArunachalAssamManipurMeghalayaMizoramNag alandTripuraMWNorth-Eastern States (MW)SectorJan '17 Jan ' 2017 PLF 2018 Jan 'JuneJulyAugSepOctNovDec* For Coal and Lignite based Power Plants 10%PLFAll India PLF Month-wise10. All India PLF* Sector-wise for Jan. INDIA% PLFS ector-Wise Plant Load Factor for Apr, 2017 and Jan, 2018 Jan '17 Jan '18020 AprilAxis TitleAxis TitleAll India PLF Month-wise201720182010-112011-122012-132 013-142014-15T&D (P)AT&C (P)Note: As per PFC for utilities selling directly to consumersP: ProvisionalTotal Number of Villages597464 Pump sets Energised as on 31-03-201620434180 Note: From the year 2004-05 onwards Definition of Village Electrification.
10 -A village would be declared Electrified ifWithout Subsidy Gap ACS-ARR( Without Subsidy) Paise/unitGap ACS-ARR (on subsidy booked basis) paise/unitGap ACS-ARR (on subsidyreceived basis) paise/unit2013-1440011876772014-15412108 5860 Source:- PFC Reports on the performance of State Power Utilities2014-1510102015-161075* # (Gross Generation+Net Import) / Mid Year Population,* Provisional2013-14 ** Actual11 Pump sets Energised as on 31-1- 2018 Average cost of supply(ACS) (paise/unit)i) Basic Infrastructure such as Distribution Transformer and Distribution lines are provided in the inhabited locality as well as Dalit Basti / hemlet where i