Transcription of JULY 2016 Census Data Bulletin - Rhode Island
1 For the May Census data Bulletin , RISPP assessed the latest, statewide 2010-2014 5-year ACS Median Household Income data . The release of the 2014 5-year ACS allowed RISPP to analyze the most recent estimates. Additionally, the 2014 5-year data release presented the RISPP with the opportunity to compare the most recent 5-Year ACS household income estimates (2010-2014) to the previous non-overlapping 5-year ACS household income estimates (2005-2009) for the first time. The data was analyzed to identify municipalities that experienced an increase or decrease in real (inflation-adjusted) median household income, as well as detect trends within the 2, 5-year estimate periods.
2 NATIONAL, REGIONAL AND STATE OF Rhode Island : 2010-2014 5-YEAR ESTIMATES The 2014 5-year ACS estimate for median household income in the was $53,482. In Rhode Island , the 2014 5-year ACS estimate for median household income was $56,423. While Rhode Island had a higher median income than the national median, it was below the median income of the Northeast Region, which was $60,501. Within Rhode Island , 32 of 39, or 82% of RI municipalities had higher median household incomes than the national median, while 31, or 79%, had higher medians than the state median income and 29, or 74% of municipalities had higher median incomes than the Northeast region.
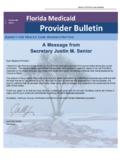
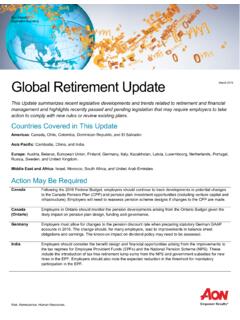
3 MEDIAN HOUSEHOLD INCOMES IN THE STATE 2010 -2014 Barrington had the highest median household income in the 2014 ACS estimates. In 2014, Barrington was the sole municipality in the state with a six-figure median household income of $103,937. See Figure 1 for a map with RI municipal median household income data . Richmond and Jamestown had the next highest median household incomes in the state in 2014 with estimates of $96,533 and $95,833, respectively. East Greenwich and New Shoreham rounded out the top 5 in the 2014 ACS 5-year estimates.
4 The municipality in the state with the lowest median household income was Central Falls at $28,842. Central Falls, Woonsocket, Providence, Pawtucket and West Warwick have the five lowest median household incomes in the state within the 2014 estimates. Low educational attainment among residents is likely contributing to the declining incomes in these urban core cities, as they all are below the statewide average of for the population 25 and over with a bachelor s degree or higher. This correlation is even more evident as Barrington, which has the highest median household income in the state has % of the population 25 and above with a bachelor s degree or higher, while Central Falls, with the lowest median household income has just Census data Bulletin PLANNING INFORMATION CENTER july 2016 Rhode Island MEDIAN HOUSEHOLD INCOME: THEN AND NOW FIGURE 1: MEDIAN HOUSEHOLD INCOME 2010-2014.
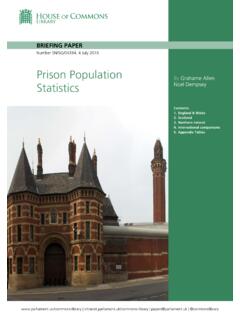
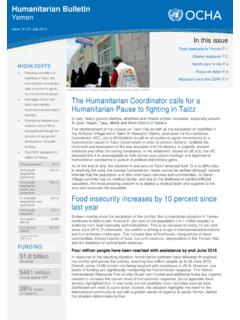
5 MUNICIPALITY 2010-2014 MEDIAN HOUSEHOLD INCOME 2005-2009 MEDIAN HOUSEHOLD INCOME (ADJUSTED 2014 DOLLARS) CHANGE (PERCENT) RICHMOND $96,533 $83,058 TIVERTON $73,438 $63,244 JAMESTOWN $95,833 $86,487 NARRAGANSETT $65,842 $60,052 FOSTER $80,720 $79,055 WESTERLY $62,381 $61,419 NORTH PROVIDENCE $53,470 $52,690 SCITUATE $80,802 $80,163 NEW SHOREHAM $90,526 $89,904 BARRINGTON $103,937 $106,205 NEWPORT $61,320 $62,677 MIDDLETOWN $70,244 $72,541 GLOCESTER $82,193 $85,516 NORTH KINGSTOWN $80,506 $84,585 COVENTRY $69,050 $73,351 PORTSMOUTH $77,483 $82.
6 730 CUMBERLAND $74,499 $79,714 WARWICK $62,803 $67,435 EAST GREENWICH $92,727 $99,855 NORTH SMITHFIELD $78,163 $84,857 EAST PROVIDENCE $51,077 $55,609 PROVIDENCE $37,514 $41,128 SMITHFIELD $71,305 $78,582 JOHNSTON $57,457 $63,322 CRANSTON $58,684 $64,966 WARREN $53,706 $59,658 WEST WARWICK $50,138 $55,840 HOPKINTON $71,636 $79,801 WEST GREENWICH $80,987 $90,586 PAWTUCKET $40,578 $45,664 SOUTH KINGSTOWN $72,021 $82,206 LINCOLN $66,827 $76,682 BRISTOL $60,988 $70,492 EXETER $83,340 $98,205 CHARLESTOWN $68,904 $81,496 BURRILLVILLE $60,666 $76,030 LITTLE COMPTON $74,698 $94,826 CENTRAL FALLS $28,842 $36,987 WOONSOCKET $35,216 $45,242 Rhode Island $56,423 $61,316 FIGURE 2: Rhode Island MEDIAN HOUSEHOLD INCOME: 2005-2009 AND 2010-2014.
7 COMPARING REAL (INFLATION-ADJUSTED) MEDIAN HOUSEHOLD INCOME IN Rhode Island 2005-2009 AND 2010-2014 As noted above, the 2014 ACS estimates presented data users with the ability to compare two non-overlapping 5-year ACS estimates (2005-2009 and 2010-2014) for the first time since the ACS began. The RISPP staff compared and analyzed the two 5-year ACS estimates to identify changes or trends at the municipal level between the two times. To compare these two non-overlapping periods, 2005-2009 and 2010-2014, RISPP staff developed a table (Figure 2) that lists each RI municipality and their real median household incomes in the 2009 and 2014 5 year ACS estimates.
8 The data within Figure 2 was derived from ACS Table B19013. In an effort to compare change amongst the two 5-year ACS estimates, the 2005-2009 estimates were adjusted to 2014 dollars by multiplying the estimates by (Consumer Price Index Research Series). Real median household income in Rhode Island fell between the 2005-2009 ACS and 2010-2014 ACS, decreasing by 9% from $61,316 to $56,423: This decrease in real median household income is consistent with a negative percent change in the United States ( ) and the northeast region ( ).
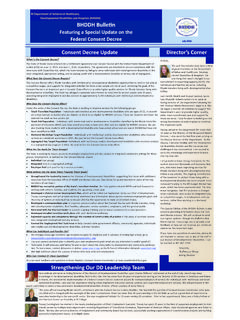
9 The data between the 2005-2009 and 2010-2014 ACS suggests that there is consistency amongst which municipalities round out the lowest 5 median household incomes in the state. While there is slight consistency within the top 5 highest median household incomes in both estimates (Barrington and East Greenwich make the top 5 in both time periods), Central Falls, Providence, Woonsocket and Pawtucket had four of the lowest median household incomes within the 2005-2009 and 2010-2014 5-year ACS estimates. Of Rhode Island s 39 municipalities, 30, or 77% experienced a decline in estimated real median household income between the 2005-2009 and 2010-2014 5-year ACS estimates.
10 Nine municipalities, or 23% experienced a positive change in real median household income between the 2009 and 2014 5-year estimates. The municipalities that that had a positive change in median household income are depicted in orange and red in Figure 3. Municipalities exhibiting the greatest increase between the two ACS periods include: Richmond ( ), Tiverton ( ) and Jamestown ( ). According to Rhode Island Department of Labor and Training's State of the State report, Richmond's increase is consistent with the 6% population growth the town has experienced from 2000-2014.