Transcription of Key Performance Indicator Targets for Beef Cow …
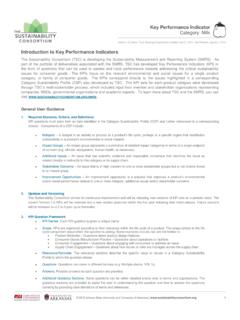
1 Key Performance Indicator Targets for beef Cow-calf OperationsStan BeversProfessor & Extension EconomistTexas A&M AgriLifeExtension ServiceVernon, TexasKey Performance Indicators (KPI) Performance Measures of Key Activities happening as a result of your management. Is management fulfilling the goals of the ownership. Tracked over Performance Indicators Production KPI follows beef Cow-calf SPA Financial KPI s follow Farm Financial Standards Council approach for accrual financial statements. It is important to calculate them Performance Indicators Need to balance the use of KPIs. To focus on one, at the expense of another, will not improve the overall Performance of the Targets Some are specifically for Cow-calf enterprises, while others cover the entire ranching operation Many ranches are involved in multiple enterprises.
2 KPI for all activities Targets have been identified through analysis of individual ranches (Cow-calf SPA, Managerial Ranch Accounting, etc.), experience, and KPI Targets 1 Production KPI 8 Financial KPIs 4 Integrated KPIs There are an unlimited number of other KPIs. Each ranch should determine those activities that are critical to your ranch s success and determine the best method to calculate a Performance . Others are not any less importantProduction KPIP ounds Weaned per Exposed Female 460 pounds per Exposed Female Should be a KPI for any ranch that owns breeding cows with the intent of weaning calves. Product of weaning percentage and weaning weights Total pounds weaned divided by all females that were exposed and intended to be KPIP ounds Weaned per Exposed Female460 pounds per Exposed Female3003504004505005502009201020112012 201320142015 Ranch 1 Ranch 2 TargetPercent Normal Rainfall05010015020025020092010201120122 01320142015 Ranch 1 Ranch 2 Percent Normal Rainfall Effect on Pounds Weaned per Cow ExposedIntegrated KPICost per Cwt.
3 Of Weaned Calf Less than $170 per Cwt. IMO: The most important number for ranch management Incorporates: Productivity Total expenses it took to get that production Every ranch has different resources; this KPI shows how efficiently those resources are being used to create productivity. Total expenses (less other revenue ) divided by total pounds weaned. $- $50 $100 $150 $200 $250 $300 $3502009201020112012201320142015 Ranch 1 Ranch 2 TargetIntegrated KPICost per Cwt. of Weaned CalfLess than $170 per KPIRate of Return on Assets (Cost Basis) Greater than percent Bottom line for ranch owners This KPI should be measured over time. Net income (plus interest paid) divided by total assets This is the driving force behind the long-term decline in breeding cow 1 Ranch 2 TargetFinancial KPIRate of Return on Assets (Cost Basis)Greater than percentIntegrated KPIR evenue per Breeding Female Greater than $950 per Breeding Female Not just the value of sold weaned calves Total revenue from weaned calf sales, retained calf values, gains/losses on the sales of breeding stock, and the accrual adjustments on inventories.
4 To compare, it should not include sales from other ranch enterprises Hay sales This target can and will move. $- $200 $400 $600 $800 $1,000 $1,200 $1,400 $1,6002009201020112012201320142015 Ranch 1 Ranch 2 TargetIntegrated KPIR evenue per Breeding FemaleGreater than $950 per Breeding FemaleFinancial KPIO perating Expense as a Percent of Total Revenue Less than 75 percent of Total Revenue Controlling expenses can be one of the most important exercises for ranch management. Operating expenses = All expenses except interest and depreciation. Given 75 % target, the ranch has 25% of the ranch revenue depreciation as net income0%20%40%60%80%100%120%140%160%2009 201020112012201320142015 Ranch 1 Ranch 2 TargetFinancial KPIO perating Expense as a Percent of Total Revenue Less than 75 percent of Total RevenueFinancial KPINet Income as a Percent of Total Revenue Greater than 5 percent of Total Revenue That portion of total revenue that is being retained as net income.
5 Four things that a ranch can do with operating interest depreciation as net income Corresponds with previous KPI-100%-80%-60%-40%-20%0%20%40%60%20092 01020112012201320142015 Ranch 1 Ranch 2 TargetFinancial KPINet Income as a Percent of Total Revenue Greater than 5 percent of Total RevenueFinancial KPIL abor and Management Expense as a Percent of Total Revenue Less than 15 percent of Total Revenue One of the most variable expenses Hired Management versus Owned Labor Include salaries, wages, taxes, benefits, and chuck. For every dollar of ranch revenue, the ranch is spending $ of that dollar to pay L&M. Total L&M divided by Total Revenue generated on the ranch0%5%10%15%20%25%30%35%40%45%2009201 020112012201320142015 Ranch 1 Ranch 2 TargetFinancial KPIL abor and Management Expense as a Percent of Total Revenue Less than 15 percent of Total RevenueFinancial KPIN utrition Base Expense as a Percentof Total Expenses Between 30 and 45 percent of Total Expense Reproduction is the most important factor in ranch productivity, thus, herd nutrition is imperative.
6 No two ranches have the same resources. Identify three types Expenditures for purchased nutrition Expenses associated with raising nutrition Costs associated with grazing These three divided by Total Expense5%10%15%20%25%30%35%40%45%50%55%2 009201020112012201320142015 Ranch 1 Ranch 2 Financial KPIN utrition Base Expense as a Percent of Total Expense Between 30 and 45 percent of Total ExpenseIntegrated KPIT otal Investment (Market Basis) per Breeding Female Between $7,500 and $12,500 Focus on the Ranch Owner Land is the greatest influencer. Total Assets divided by total number of breeding females as of January 1. Assumes some land is already controlled Demonstrates the real difficulty for beginning ranchers Potential heirs looking at this figure and $0$2,500$5,000$7,500$10,000$12,500$15,00 0$17,500$20,0002009201020112012201320142 015 Ranch 1 Ranch 2 Integrated KPIT otal Investment (Market Basis) per Breeding FemaleBetween $7,500 and $12,500 Financial KPIA sset Turnover Ratio (Cost Basis) Greater than 15 percent Given the highly capitalized nature of ranching, it is vital for the manager to generate the greatest possible net income.
7 This KPI details how many revenue dollars each dollar of asset is creating. Target: Every dollar of asset is generating $ of revenue. Seems low, but that demonstrates the nature of ranching05101520253035404520092010201120 12201320142015 Ranch 1 Ranch 2 TargetFinancial KPIA sset Turnover Ratio (Cost Basis)Greater than 15 percentKPI Targets I didn t show you Current Ratio Greater than Debt per Breeding Female Less than$500 per female Equity to Asset Ratio Greater than 50%KPI Targets Not Common to All Ranches Hay Production Cost per Ton Less Than $150/ton Cost of Gain on Small Annual Pasture Others?Key Performance Indicator Targets for beef Cow-calf OperationsStan BeversProfessor & Extension EconomistTexas A&M AgriLifeExtension Box 2159 Vernon, Texas940 552-9941 ext. RollingPlainsAg