Transcription of Key wordl energy stastti ics - International Energy …
1 Key world Energy statisticsAlso available on smartphones and tablets2017 KEY WORLDENERGY 130/08/2017 14:33:54 IEA member countries: Australia Austria BelgiumCanadaCzech RepublicDenmarkEstoniaFinlandFranceGerma nyGreeceHungaryIreland ItalyJapanKoreaLuxembourgNetherlandsNew ZealandNorwayPolandPortugalSlovak RepublicSpain SwedenSwitzerlandTurkeyUnited KingdomUnited StatesThe European Commissionalso participates inthe work of the EnergyAgencySecure Sustainable 230/08/2017 14:33:56 The International Energy Agency (IEA) was established in 1974 to promote Energy security and provide authoritative analysis on Energy for its member countries and beyond.
2 Energy statistics have always been and remain at the heart of the work of the IEA. They provide a comprehensive view on Energy production, transformation and fi nal use, the factors that infl uence Energy choices such as prices and RD&D and the wider impact of Energy use on CO2 emissions. Over the years with input from Energy statisticians all around the world, the IEA has gained recognition as the world s most authoritative source for Energy statistics are produced to be used: to monitor changes in Energy production and use; inform debate; and provide a wider understanding of Energy .
3 In Key World Energy Statistics (KWES), we look to highlight some of the key facts and trends from across the vast number of datasets the IEA produces to enable everyone to know more about Energy . As part of the IEA modernisation programme, this year s edition of KWES has been updated. It contains more information on Energy effi ciency and renewables, more geographic data including on the IEA Family , created through our Open Doors policy and also more of the fundamental data required to fully understand Energy security the heart of our Energy plays such a vital role in our lives today, I hope that these statistics will not only inform but also help policy makers and others to make wise decisions so that Energy is produced and consumed in a secure, affordable.
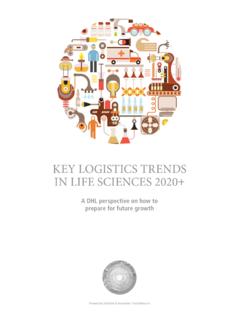
4 Effi cient and sustainable I like to say, in the world of Energy , data always wins. I would therefore like to thank Duncan Millard, the IEA Chief Statistician, and his excellent team for their work in ensuring we all have the data needed to gain a comprehensive understanding of Fatih BirolExecutive Director, International Energy AgencyKWES is a summary of the comprehensive data made available by the IEA via its website: It is also available in app form for all major mobile 330/08/2017 14:33 430/08/2017 14:33:56 SupplyTransformationConsumptionEnergy balancesEnergy efficiencyPricesEmissionsResearch, development and demonstration (RD&D)OutlookEnergy indicatorsConversion 530/08/2017 14:33:566 SupplyWorld total primary Energy supply (TPES) by fuelOther3 Natural gasOilBiofuels and wasteCoal2 NuclearHydro 02 0004 0006 0008 00010 00012 00014 00016 0001971197519801985199019952000200520102 015 World TPES from 1971 to 2015 by fuel (Mtoe)1973 and 2015 fuel s hares of TPES1.
5 World includes International aviation and International marine In these graphs, peat and oil shale are aggregated with Includes geothermal, solar, wind, tide/wave/ocean, heat and 101 Mtoe13 647 MtoeCoal and Other and Other 7 630/08/2017 14:33:567 SupplyOECD total primary Energy supply by fuelOther3 Natural gasOilBiofuels and wasteCoal2 NuclearHydro 01 0002 0003 0004 0005 0006 0001971197519801985199019952000200520102 016 OECD TPES1 from 1971 to 2016 by fuel (Mtoe)1973 and 2016 fuel shares of TPES11. Excludes electricity In these graphs, peat and oil shale are aggregated with coal.
6 3. Includes geothermal, solar, wind, tide/wave/ocean, heat and and Other and Other 740 Mtoe5 257 Mtoe19 7 730/08/2017 14:33:578 SupplyNon-OECD Europe and EurasiaNon-OECD AmericasNon-OECD Asia1 Middle EastChinaOECDB unkers2 Africa 02 0004 0006 0008 00010 00012 00014 00016 0001971197519801985199019952000200520102 015 World TPES from 1971 to 2015 by region (Mtoe)1973 and 2015 regional shares of TPES6 101 Mtoe13 647 Mtoe1. Non-OECD Asia excludes Includes International aviation and International marine Middle East Europe and Asia Middle Non-OECD Europe and Non-OECD Asia 19 7 32015 World total primary Energy supply by 830/08/2017 14:33:579 Supply 02 0004 0006 0008 00010 00012 00014 00016 0001971197519801985199019952000200520102 015 Other countries1 IEA Accession countries1 IEA Association countries1 Bunkers2 IEA11973 and 2015 regional shares of TPES6 101 Mtoe13 647 Mtoe1.
7 Please see geographical coverage for the list of IEA Accession, Association and other Includes International aviation and International marine 7 32015 IEA IEAA ccessioncountries Othercountries Othercountries Bunkers TPES from 1971 to 2015 (Mtoe)World total primary Energy supply by 930/08/2017 14:33:5810 Supply 02 0004 0006 0008 00010 00012 00014 00016 000199019952000200520102015 OceaniaAfricaBunkers1 AfricaAsiaEuropeAmericasWorld TPES from 1990 to 2015 by region (Mtoe)1990 and 2015 regional shares of TPES8 774 Mtoe13 647 Mtoe1.
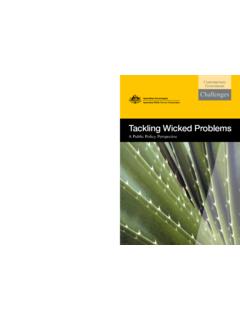
8 Includes International aviation and International marine 9 02015 World total primary Energy supply by geographical 1030/08/2017 14:33:5811 SupplyOECD EuropeOECD Asia and OceaniaOECD Americas 01 0002 0003 0004 0005 0006 0001971197519801985199019952000200520102 0161973 and 2016 regional shares of TPES3 740 Mtoe5 257 Mtoe1. Excludes electricity 7 OECD Asiaand OECDE urope OECD Asiaand OECDE urope OECD TPES1 from 1971 to 2016 by region (Mtoe)OECD total primary Energy supply by 1130/08/2017 14:33:5912 SupplyNon-OECD Europe and EurasiaChinaMiddle EastNon-OECD AmericasAfricaNon-OECD Asia2 OECD 0 5001 0001 5002 0002 5003 0003 5004 0004 5005 and Non-OECD Asia and Non-OECDAsia crude oil1 production from 1971 to 2016 by region (Mt)1973 and 2016 regional shares of crude oil1 production2 869 Mt4 321 Mt1.
9 Includes crude oil, NGL, feedstocks, additives and other Non-OECD Asia excludes 7 32016 Crude oil 1230/08/2017 14:39:2813 SupplyNet importers MtUnited States 348 People s Rep. of China 333 India 203 Japan 165 Korea 139 Germany 91 Italy 67 Spain 65 Netherlands 59 France 57 Others 514 Total 2 041 Net exporters MtSaudi Arabia 369 Russian Federation 243 Iraq 148 United Arab Emirates 125 Canada 116 Nigeria 104 Kuwait 100 Venezuela 98 Angola 86 Islamic
10 Rep. of Iran 64 Others 539 Total 1 9922016 provisional data2015 data2015 data1. Includes production of crude oil, NGL, feedstocks, additives and other hydrocarbons. Excludes liquids from other fuel sources (renewable, coal and natural gas). % ofProducers Mt world totalSaudi Arabia 583 Federation 546 States 537 220 Rep. of Iran 200 s Rep. of China 200 191 Arab Emirates 182 159 135 of the world 1 368 4 321 oil productionProducers, net exporters and net importers of crude 1330/08/2017 14:34 Europe and Non-OECD Europe and Non-OECD 0 5001 0001 5002 0002 5003 0003 5001971197519801985199019952000200520102 016 Non-OECD Europe and EurasiaChinaMiddle EastNon-OECD AmericasAfricaNon-OECD Asia1 OECDW orld natural gas production from 1971 to 2016 by region (billion cubic metres, bcm)1973 and 2016 regional shares of natural gas production1 224 bcm3 613 bcm1.