Transcription of Kinds of accident in Great Britain, 2017
1 This document is available from Page 1 of 7 Health and Safety Executive Kinds of accident in Great Britain, 2017 Contents Summary 2 Introduction 3 Fatal Injuries 3 Non-fatal injuries 4 Sources and definitions used 6 This document is available from Page 2 of 7 Summary The document can be found at: Fatal injuries to workers by most common accident Kinds (Source: Fatal injuries reportable under RIDDOR, 2012/13-2016/17) Non-fatal injuries to workers by most common accident Kinds (Source: LFS self-reported non-fatal injuries, 2014/15-2016/17) Note: LFS: Labour Force Survey RIDDOR: Reporting of Injuries Diseases and Dangerous Occurrences Regulations The most common accident Kinds included in the charts above are those that account for 5% or more of injuries This document is available from Page 3 of 7 Introduction In 2016/171, 137 workers2 were killed at work and an estimated 609,000 workers3 suffered non-fatal injuries as a result of work activity, resulting in around million working days lost.
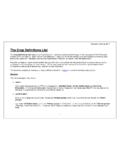
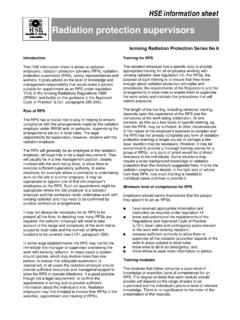
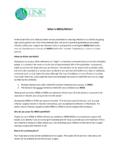
2 Despite long term reductions in the number of workers injured each year, the Kinds of accident sustained (and their profile in relation to severity) remain similar year-on-year. Fatal Injuries Fatal injuries at work are thankfully rare events. There is a degree of chance and randomness to the annual fatality count resulting in an element of natural variation from one year s count to the next. To reduce the effect of year-on-year fluctuations and provide a more stable picture of fatal injuries by accident kind, figure 1 below presents the annual average estimate of the number of fatal injuries to workers by accident kind for the five-year period 2012/13-2016/17. (There were a total of 712 fatal injuries over this period, an annual average of 142.) Figure 1: Number of fatal injuries to workers per year by accident kind Source: RIDDOR, annual average 2012/13-2016/17p4 Almost half of the fatal injuries over the last five years were accounted for by just two different accident Kinds falls from a height and being struck by a moving vehicle Falls from a height accounted for an average of 40 fatal injuries per year (28% of the total): Just under a half of all fall from height deaths over the last five years were in the construction sector (annual average 19 per year).
3 Agriculture, forestry and fishing saw an average of five such deaths per year, and there was an average of four deaths per year over the period resulting from falls from a height in manufacturing. Struck by a moving vehicle accounted for an average of 25 fatal injuries per year (17% of the total): Over a quarter of deaths over the last five years from being struck by a moving vehicle were in the agriculture, forestry and fishing sector (annual average of seven per year). On average there were five such deaths per year in the transport and storage sector, and an annual average of four in construction over this five-year period. Of the deaths in the All other accident Kinds category (average of 21 deaths per year), there were: An average of two deaths per year for each of strike against something fixed or stationary, slips, trips or falls on the same level, exposure to fire, exposure to an explosion, and acts of violence; An annual average of one death per year from handling, lifting or carrying accidents and from being exposed to harmful substances.
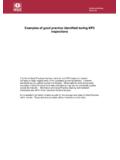
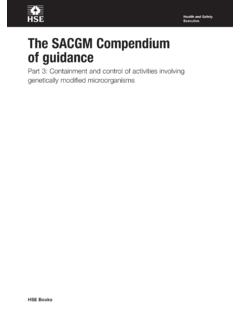
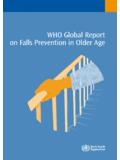
4 The remaining deaths were categorised as other kind of accident . For more details of accident kind by industry sector see 1 Data is presented on a financial year basis (April-March). 2 The term workers includes employees and the self-employed combined. 3 This estimate of 609,000 workers is based on annual data for 2016/17. The subsequent estimate in figure 2 for total workplace injury broken down by accident kind is an annual average estimate based on 3-years data from 2014/15-2016/17. The 3-year annual average estimate shows an average of 614,000 workers injured annually between 2014/15 and 2016/17. 4 p Provisional data. This document is available from Page 4 of 7 Non-fatal injuries The profile of non-fatal injuries by accident kind differs quite markedly to the profile of fatal injuries. Figure 2: Self-reported non-fatal injuries to workers by accident kind Source: Labour Force Survey, annual average estimate 2014/15-2016/17 Almost 40% of self-reported non-fatal injuries to workers over the period 2014/15-2016/17 were accounted for by just two different accident Kinds ; handling, lifting or carrying accidents (20% of total, estimated 122,000 cases per year) and slip trip or fall accidents (18% of total, estimated 111,000 cases per year).
5 In contrast these accounted for only 2% of fatal injuries to workers over the period 2012/13-2016/17. Falls from a height, the most common cause of fatal injury to workers over the last five years, accounted for just 7% of self-reported non-fatal injuries over the period 2014/15-2016/17 (estimated 43,000 cases per year). The estimates in figure 2 above are from the Labour Force Survey (LFS) and include all injuries to workers, regardless of whether they took time off work as a result. The LFS provides the most complete measure of the scale of workplace injury. A supplementary source of injury data, providing data at more detailed levels, is from injury notifications made under the Reporting of Injury, Diseases and Dangerous Occurrence Regulations (RIDDOR). These regulations require employers to report fatal and certain non-fatal injuries. RIDDOR is known to suffer from under-reporting and therefore under-estimates the scale of workplace injury.
6 However, it provides valuable supplementary data to the LFS, particularly at more detailed levels such as injuries by accident kind. For more detail on data sources see Figure 3 shows the accident kind distribution for over-7-day injuries to workers from the LFS as compared with the accident kind distribution for RIDDOR non-fatal injuries to employees. Both sources present a very similar picture in terms of the relative importance of different non-fatal accident Kinds . Figure 3: Percentage of non-fatal injuries accounted for by different accident Kinds based on (i) Self-reported over-7-day injuries to workers from the LFS and (ii) RIDDOR non-fatal injuries to employees Source: Labour Force Survey, annual average 2014/15-2016/17, RIDDOR 2016/17p This document is available from Page 5 of 7 RIDDOR collects injury data against a wider range of accident kind categories than the LFS.
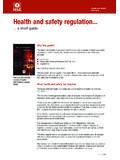
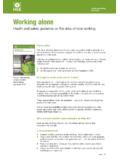
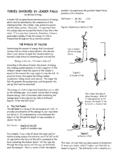
7 However, none of these additional categories (which are included in All other accident Kinds in figure 3 above) accounted for more than about 2% of all reported non-fatal injuries in 2016/17. The only additional categories accounting for more than 1% of reported non-fatal injuries were: Struck by a moving vehicle (2%) Exposure to, or contact with, a harmful substance (1%) RIDDOR defines two categories of reportable non-fatal injuries: specified (a pre-defined list of injuries); and over-7-day. The specified injury listing consists of eight injury types. Fractures, other than to fingers, thumbs or toes, is the biggest specified injury category accounting for 90% of all reported specified injuries in 2016/17. (For details of all specified injury categories see ) Given the dominance of fractures to the specified injury category, not surprisingly there is some variation in accident kind between specified injuries and over-7-day injuries, as shown in figure 4 below.
8 Figure 4: Percentage of (i) Specified injuries and (ii) Over-7-day injuries to employees accounted for by different accident Kinds 2016/17p Source: RIDDOR 60% of specified injuries to employees were accounted for by just two accident kind categories, namely slips, trips or falls on the same level and falls from a height. This is a much larger proportion than for over-7-day injuries (28%). Conversely, only 7% of specified injuries to employees were accounted for by handling, lifting or carrying accidents, compared with 27% for over-7-day injuries. For details of employer-reported non-fatal injuries by kind of accident for specific industries see This table allows you to flexibly view the data. For example you can view the accident Kinds for a specific industry (such as construction) or you can look at a particular accident kind (such as falls from a height) and see the percentage contribution that accident kind makes to the total injury count for each industry.
9 Detailed data tables for self-reported non-fatal injuries by accident kind can be found at This document is available from Page 6 of 7 Sources and definitions used 1. The Labour Force Survey (LFS) The LFS is a national survey run by the Office for National Statistics of currently around 37,000 households each quarter. HSE commissions annual questions in the LFS to gain a view of work-related illness and workplace injury based on individuals perceptions. The analysis and interpretation of these data are the sole responsibility of HSE. See for more details. Self-reported injuries: Workplace injuries sustained as a result of a non-road traffic accident , as estimated by the LFS. HSE has collected data on injuries through the LFS in 1990 and annually since 1993/94. LFS injury estimates are generally presented as three-year averages to provide a more robust series of estimates.
10 Working days lost: Days off work due to workplace injuries (and work-related ill health). The figures are expressed as full-day equivalents, to allow for variation in daily hours worked. 2. RIDDOR The Reporting of Injuries, Diseases and Dangerous Occurrences Regulations (as amended), under which fatal and defined non-fatal injuries to workers and members of the public are reported by employers. Certain types of work-related injury are not reportable under RIDDOR, hence excluded from these figures. Particular exclusions include fatalities and injuries to the armed forces and injuries from work-related road collisions. For more information, see Crown copyright If you wish to reuse this information visit for details. First published 11/17. Published by the Health and Safety Executive V1 11/17 National Statistics National Statistics status means that official statistics meet the highest standards of trustworthiness, quality and public value.