Transcription of Lecture 11: Graphs of Functions - University of Notre Dame
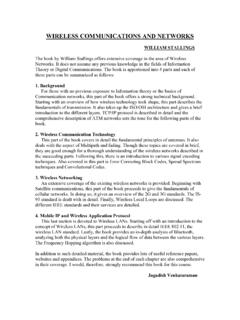
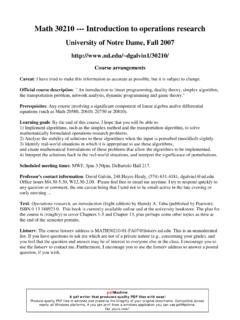
1 Lecture 11: Graphs of FunctionsDefinitionIffis a function with domainA, then thegraphoffis the set of all ordered pairs{(x, f(x))|x A},that is, the graph offis the set of all points (x, y) such thaty=f(x). This is the same as the graphof the equationy=f(x), discussed in the Lecture on Cartesian graph of a function allows us to translate between algebra and pictures or function of the formf(x) =mx+bis called alinear functionbecause the graph of the correspondingequationy=mx+bis a line. A function of the formf(x) =cwherecis a real number (a constant) iscalleda constant functionsince its value does not vary the Graphs of the Functions :f(x) = 2,g(x) = 2x+ functionsAs you progress through calculus, your ability to picture the graph of a functionwill increase using sophisticated tools such as limits and derivatives. The most basic method of gettinga picture of the graph of a function is to use the join-the-dots method.
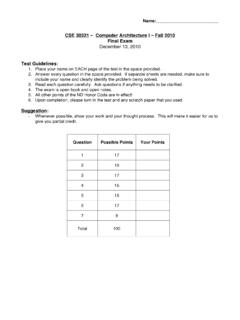
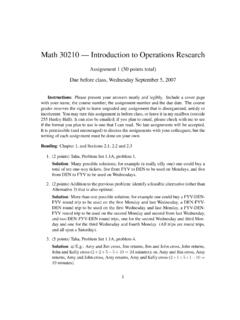
2 Basically, you pick a few valuesofxand calculate the corresponding values ofyorf(x), plot the resulting points{(x, f(x)}and jointhe in the tables shown below for the functionsf(x) =x2,g(x) =x3,h(x) = xand plot the corresponding points on the Cartesian plane. Join the dots to get a picture of the graphof each (x) =x2 3 2 10123xg(x) =x3 3 2 10123xh(x) = x01491625361 Graph off(x) = 1/xxf(x) = 1/x 100 10 10?110100xf(x) = 1/x 1/10 1/100 1/10000?1/10001/1001/102 Getting Information From the Graph of a functionSuppose the following graph shows the distance a runner in a 30 mile race has coveredthours after thebeginning of a race.(a) Approximately how much distance has the runner covered after 1 hour?(b) Approximately how long does it take for the runner to complete the course (30 miles)?Domain and Range on GraphThedomainof the functionfis the set of all values ofxfor whichfis defined and this correspondsto all of thex-values on the graph in thexy-plane.)
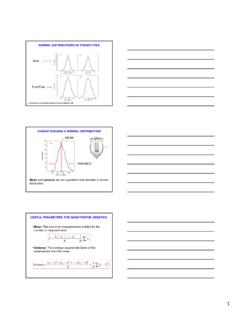
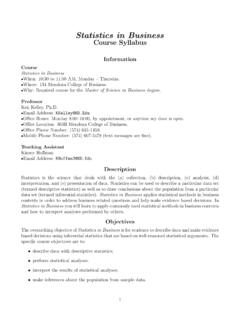
3 Therangeof the functionfis the set of all valuesf(x) which corresponds to theyvalues on the graph in the graph shown below to find the domain and range of the functionf(x) = 3 1 Piecewise defined functionsRecall that a piecewise defined function is typically defined by different formulas on different parts ofits domain. The graph, therefore consists of separate pieces as in the example shown below. We use a solid point at the end of a piece to emphasize that that point is on the graph. Forexample, the point (3,3) is on the graph here, whereas the point above it, (3,9), at the end of theportion of the graph ofy=x2is not. We use a circle to denote that a point is excluded. For example the value of this function at 5 is0, therefore the point (5,0) is on the graph as indicated with the solid dot. The point above it onthe liney=x, (5,5), is not on the graph and is excluded from the graph.
4 We indicate this witha circle at the point (5,5). Note that the formulay=1x 10does not make sense whenx= 10. Thereforex= 10 is not inthe domain of this function. As the values ofxget closer and closer to 10 from above, the valuesof1x 10get larger and larger. Therefore theyvalues on the graph approach + as we approachx= 10 from the right. On the other hand the y values on the graph approach asxapproaches10 from the left. Although there is no point on the graph atx= 10, the (computer generated)graph shows a vertical line atx= 10. This line is called avertical asymptoteto the graph andwe will discuss such asymptotes in more detail in the piecewise defined functionf(x) = x < x 12x1< x <21x= 2x2x >2 ExampleGraph the absolute value functiong(x) ={ x x <0x x 05 Graphs of equations ; Vertical Line Testit is important in calculus to distinguish between the graph of a function and Graphs of equations whichare not the Graphs of Functions .}
5 We will develop a technique called implicit differentiation to allow usto compute derivatives at ( some) points on the Graphs of equations which are not Graphs of is therefore important to be fully aware of the relationship between Graphs of equations and graphsof that the defining characteristic of a function is that for every point in the domain, we getexactly one corresponding point in the range. This translates to a geometric property of the graph ofthe functiony=f(x), namely that for eachxvalue on the graph we have a unique correspondingyvalue. This in turn is equivalent to the statement that if a vertical line of the formx=acuts thegraph ofy=f(x), it cuts it exactly once. Therefore we get a geometric property which characterizesthe Graphs of Functions :Vertical Line PropertyA curve in thexy-plane is the graph of a function if and only if no verticalline intersects the curve more than that the graph of an equation inxandyis the set of all points (x, y) in the plane which satisfythe equation.
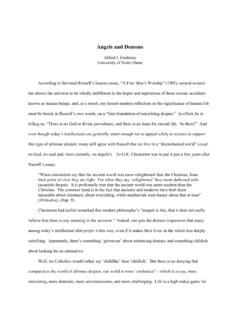
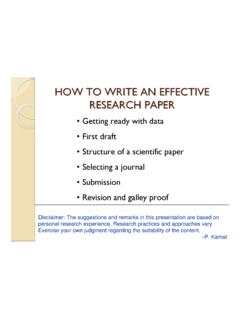
6 For example the graph of the equationx2+y2= 1 is the unit circle (circle of radius 1centered at the origin). +y2=1If we can solve foryuniquely in terms ofxin the given equation, we can rearrange the equation to looklikey=f(x) for some function ofx. Rearranging the equation does not change the set of points whichsatisfy the equation, that is, it does not alter the graph of the equation. Sobeing able to solve foryuniquely in terms ofxis the algebraic equivalent of the graph of the equation being thegraph of a function. This is equivalent to the graph of the equation having the vertical line propertygiven Line TestThe graph of an equation is the graph of a function (or equivalently if we can solveforyuniquely in terms ofx) if no vertical line cuts the curve more than generally, this applies to Graphs given in pieces which may be the graph of a piecewise definedfunction. One or several curves in thexyplane form the graph of a function (possibly piecewise defined)if no vertical line cuts the collection of curves more than of the following curves are Graphs of Functions ?
7 +y2L2=25Hx2-y2L-10-5510-1123452Hx+y3L=25 Hx2-y3 LLet us see what happens if we try to solve foryin an equation which describes a curve which does notpass the vertical line test. If we try to solve foryin terms ofxin the equationx2+y2= 25we get 2 new equationsy= 25 x2andy= 25 graph of the equationx2+y2= 25 is a circle centered at the origin (0,0) with radius 5 and theabove two equations describe the upper and lower halves of the circle 2 4 55x2 + y2 = 2542 2 4 6 5510gx() = 25 x2642 2 4 6 5510fx() = 25 x2 The Graphs of the upper and lower halves of the circle are the Graphs of Functions , but the circle itselfis is a catalogue of basic Functions , the Graphs of which you should memorize for future reference:LinesVerticalHorizontalGeneral x=aay=aay=mx+bbPower Functionsy=x20y=x30 Root Functionsy=x0y=x30 Absolute Value Functiony= 1/xy= x 0y=1 x08