Transcription of Lecture 14: Rate of Nucleation
1 1 Lecture 14: Rate of Nucleation Today s topics Two energetic factors that affect Nucleation rate: the activation energy barrier ( G*) that needs to be overcome to produce a critical-size nucleus, and the activation energy for an atom to migrate across the interface separating the nucleus and matrix, and thus get attached to the growing incipient nucleus. Temperature dependence of Nucleation rate: an approximate treatment by Turnbull. Overall kinetics of a phase transformation depends on both Nucleation and grain growth . Effect of Nucleation rate on the kinetics of solid solid phase transformation: time-temperature-transformation (TTT) diagrams. About Nucleation Rate (Kinetics) Nucleation is a competition between the capillary forces (surface energies) that resist the creation of new interfaces and a driving force to grow a more stable phase.
2 The overall rate of Nucleation is a product of the equilibrium number of critical size nuclei and the frequency that atoms successfully transfer from the parent phase into the nucleus. Practical application of Nucleation and growth kinetics is often made from Time-Temperature-Transformation (TTT) diagrams. TTT diagrams contain several curves, each representing a particular constant value fraction of total transformed volume after a particular time for a fixed annealing temperature. The diagrams are usually determined by experiment, but their common C -shape follows from Nucleation and growth kinetics. Exact mathematical description of Nucleation rate is difficult to derive. An approximate treatment, which describes the temperature dependence, was first given by Turnbull.
3 In a phase transformation, say a b, -phase must nucleate and grow. The kinetics of such phase transformation is cooperatively determined by two kinetic factors: Nucleation and growth , as depicted in Figure cited from the Book, "Phase Transformations in Metals and Alloys", by D. A. Porter, K. E. 2 Easterling and M. Y. Sherif, CRC Press, third edition. Here in this Lecture , we only focus on the kinetics of Nucleation . For Nucleation to occur, the cluster size must be greater than the critical nucleus size, r*, at which the activation barrier is G*. Additionally, there is also a barrier ( Gm) for an atom to cross the interface separating the nucleus and the matrix. So, the rate of Nucleation (I) consists of these two factors.
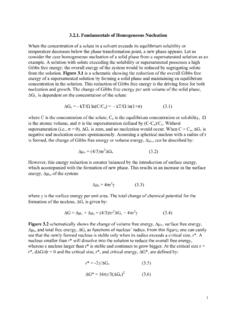
4 The Nucleation rate, defined as number of nucleus formed per unit volume in unit time, is given by I = K (T) exp [] = K (T) expexp Where KB is the Boltzmann constant, and T is the temperature. The pre-exponent factor K (T) is given by K (T) = n* N0 (no derivation) (*)mBGGKTD+D-*()BGKTD-()mBGKTD-21/2*()mB rGKTabgD G r* r G* DGm 3 Where, N0 = number of atoms/unit volume, n* = number of surface atoms across a nucleus, and is the atomic vibration frequency. According to Turnbull, theoretical value of K for mercury just below the melting point is 1035.
5 Experimentally, Turnbull estimated to be 1042 2. From previous Lectures, we have, G* = As T decreases, T = TM T increases, then G* decreases and exp [] increases. Thus, as T is lowed below TM, the Nucleation rate increases --- T , T , G* , I Meanwhile, as T decreases, exp [] decreases, The net effect combining the two terms above is that the Nucleation rate, I, must go through a maximum, as depicted in the diagram below. Now consider two extreme conditions: 1. when T TM, G* , then, exp [] 0, and meanwhile, the term exp [] a finite value. So, I = 0 finite 0 2. when T 0, G* is finite, but G*/KBT , then, exp [] 0, and meanwhile the term exp [] also 0. So, I = 0 0 0 Thus, the Nucleation rate, I, must exhibit a maximum between 0 and TM, as shown above in the diagram.
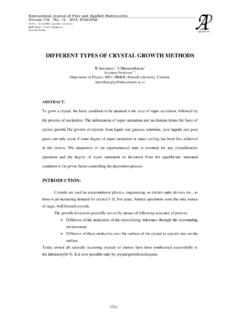
6 Effect of Nucleation Rate on the Kinetics of Solid >Solid Phase Transformation as described by 3322216163()3()()VVGST ababggpp=DDDTKGB*D-mBGKTD-TKGB*D-mBGKTD- TKGB*D-mBGKTD-I TM 0 4 Time-Temperature-Transformation (TTT) Diagrams: It is a tradition in the metallurgical literature to plot phase transformation kinetics in a Time-Temperature-Transformation (TTT) Diagram, log(time) on x-axis vs. temperature (T) on y-axis. The following TTT diagram is for > (solid-solid) transformation. The above figure shows the time required at any temperature for the formation of 1% of the -phase, and also for the formation of 99% of the -phase. The former is essentially the beginning of transformation ( Nucleation stage), while the latter is the end of transformation (the end of growth stage).
7 For the Nucleation part: At T TM, G* , then, exp [] 0 exp [] finite value. So, I = 0 At T 0, G* is finite, but G*/KBT , then, exp [] 0, also, , then, exp[] 0 So, exp []exp[] 0, I = 0 Implications of TTT diagram in glass forming system, ceramics and metals: To form a glass, a molten mass contains SiO2 and other constituents, usually alkali oxides, alkaline earth oxides, TKGB*D-mBGKTD-TKGB*D-mBGKTDmBGKTD-TKGB*D -mBGKTD-T Ttr Log t decreasing 1% transformation 99% transformation (TM) T Ttr decreasing low Nucleation rate (TM) steeper Log t 5 aluminum oxides, etc, has to be cooled at a rate faster than needed for forming crystals (the quartz).
8 If the cooling rate is fast enough, the nose of the TTT curve can be avoided leading to formation of a glass. Note: lime (calcium oxide (CaO), generally obtained from limestone), and magnesium oxide (MgO) and aluminium oxide (Al2O3) are usually added to the silica to provide better chemical durability. The resulting glass contains about 70 to 74% silica by weight and is called a soda-lime glass. If the cooling rate is greater than the critical rate, glass forms. So, glass formation can be controlled by cooling rate. In most silicate system, Nucleation is slow, due to high viscosity (network formation) low diffusivity.
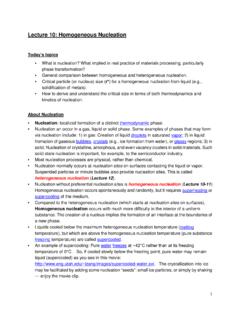
9 Thus, glass formation can be achieved at modest cooling rate In metals, Nucleation occurs rapidly. To form metallic glass (amorphous), one has to cool the liquid metals very fast (106 degree/sec). The process is called Splat cooling. The first reported metallic glass was an alloy (Au75Si25) produced at Caltech by W. Klement (Jr.), Willens and Duwez in 1960. This and other early glass-forming alloys had to be cooled extremely rapidly (on the order of one megakelvin per second, 106 K/s) to avoid crystallization. --- For a eutectoid carbon steel ( C) of thin section, if the quench starting at 750 C and ending at 450 C takes place in seconds (a rate of 430 C/s) no pearlite will form and the steel will be martensitic with small amounts of retained austenite.
10 For steel carbon the martensite has the appearance of lath, and is called lath martensite. For steel greater than 1% carbon it will form a plate like structure called plate martensite. Between those two percentages, the physical appearance of the grains is a mix of the two. The strength of the martensite is reduced as the amount of retained austenite grows. If the cooling rate is slower than the critical cooling rate, some amount of pearlite will form, starting at the grain boundaries, where it will grow into the grains until the martensite start temperature (Ms) is reached, then the remaining austenite transforms into martensite at about half the speed of sound in steel. --- T decreasing faster critical cooling rate crystal glass Log tn