Transcription of Lecture 22: Spinodal Decomposition: Part 1: general ...
1 1 Lecture 22 : Spinodal decomposition : Part 1: general description and practical implications Today s topics basics and unique features of Spinodal decomposition and its practical implications. The relationship between the phase diagram and the free energy ( G) vs. composition plot. Initial understanding of Spinodal decomposition from the Cahn-Hilliard Equation. About Spinodal decomposition Spinodal decomposition is a mechanism by which a solution of two or more components can separate into distinct phases with distinctly different chemical compositions and physical properties. This mechanism differs from the classical nucleation (as we went through in previous Lectures #10-14): the phase separation due to Spinodal decomposition is much more defined, and occurs uniformly throughout the material not just at discrete nucleation sites.
2 (see an animation for the microstructural evolution under the Cahn Hilliard equation, demonstrating distinctive coarsening and phase separation through Spinodal decomposition : ~lzang/ ; and also a movie clip simulating the phase separation due to Spinodal decomposition on a hexagonal lattice (from Oono, Y. and Puri, S., Study of phase-separation dynamics by use of cell dynamical systems. I. Modeling, Physical Review A ( general Physics), Volume 38, Issue 1, July 1, 1988, ): ~lzang/ ) Spinodal decomposition is of interest primarily due to its inherent simplicity, and thus represents one of the few phase transformations in solids for which there is any plausible quantitative theory .
3 Since there is no thermodynamic barrier to the reaction inside of the Spinodal region, the decomposition is determined solely by diffusion. Thus, the process can be treated purely as a diffusion problem, and many of the characteristics of the decomposition can be described by an approximate analytical solution to the general diffusion equation. In contrast, theories of nucleation and growth have to invoke the thermodynamics of fluctuations, and the diffusion problem involved in the growth of the nucleus is far more difficult to solve, because it is unrealistic to linearize the diffusion equation. Spinodal decomposition is also of interest from a more practical standpoint, as it provides a means of producing a very finely dispersed microstructure that can significantly enhance the physical properties of the material.
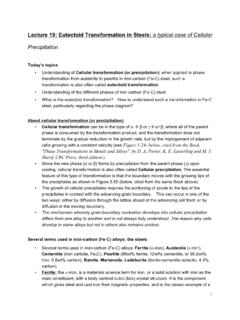
4 A lot of examples of materials in real practice require such defined phase segregation. One example is the plastic solar cells 2 (see picture below), where the C60 and polymer phase should be well separated to provide separate charge carrier transport thus minimizing the charge recombination, but meanwhile still maintaining the large interface contact to maximize the photoinduced charge separation to produce the free charge carriers (electrons and holes), which in turn demands uniform, very finely dispersed micro- or even nanoscale structured phases of the n-type and p-type materials. To this end, the smaller the segregation (the wavelength, , as to be described below), the large the interface, and thus the more the n-p contact, and thus the more efficient for the photoinduced charge separation.
5 Plastic solar cell device based on a sanwiched compsoiteds of conducting polymer and C60: In (a) both the polymer nanospheres as well as the fullerene phase offer percolated pathways for the transport of holes and electrons, respectively. In (b) electrons and holes suffer recombination, as the percolation is not sufficient. High resolution TEM images of regioregular polymer:C60 (P3HT:PCBM 1 ) blend films cast from chlorobenzene, (a) as cast, (b) annealed at 150 C for 30 min and (c) for 2 hours. Clearly visible are the spherical P3HT nanostructures with a size on the order of 10 nm. Several Important Terms: Miscibility Gap: Area within the coexistence curve of an isobaric phase diagram (temperature vs composition) or an isothermal phase diagram (pressure vs.)
6 Composition). A miscibility gap is observed at temperatures below an upper critical solution temperature (UCST) or above the lower critical solution 3 temperature (LCST). Its location depends on pressure. In the miscibility gap, there are at least two phases coexisting. Below is an example of Liquid-Liquid Equilibrium (Miscibility Gap) Mixture of Ethanol and Dodecane. Binodal Curve or Coexistence Curve: It is a curve (like the bell-like one shown above) defining the region of composition and temperature in a phase diagram for a binary mixture across which a transition occurs from miscibility of the components to conditions where single-phase mixtures are metastable or unstable.
7 Binodal compositions are defined by pairs of points on the curve of Gibbs energy of mixing vs composition that have common tangents, corresponding to compositions of equal chemical potentials of each of the two components in two phases. Spinodal Curve: A curve that separates a metastable region from an unstable region in the coexistence region of a binary mixture. Above the Spinodal curve the process of moving towards equilibrium occurs by droplet nucleation, while below the Spinodal curve there are periodic modulations of the order parameter, which have a small amplitude at first ( , Spinodal decomposition ). Spinodal curve is not a sharp boundary in real systems as a result of fluctuations.
8 Phase Diagram and Free-energy Diagram of Spinodal decomposition : As a special case of phase transformation, Spinodal decomposition can be illustrated on a phase diagram exhibiting a miscibility gap (see the diagram below). Thus, phase separation occurs whenever a material transitions into the unstable region of the phase diagram. The boundary of the unstable region, sometimes referred to as the binodal or coexistence curve, is found by performing a common tangent construction of the free-energy diagram. Inside the binodal is a region called the Spinodal , which is found by determining 4 where the curvature of the free-energy curve is negative. The binodal and Spinodal meet at the critical point.
9 It is when a material is moved into the Spinodal region of the phase diagram that Spinodal decomposition can occur. If an alloy with composition of X0 is solution treated at a high temperature T1, and then quenched(rapidly cooled) to a lower temperature T2, the composition will initially be the same everywhereand its free energy will be G0 on the G curve in the following diagram. However, the alloy will beimmediately unstable, because small fluctuation in composition that produces A-rich and B-richregions will cause the total free energy to decrease. Therefore, up-hill diffusion (see theillustration at the end of this Lecture ) takes place until the equilibrium compositions X1 and X2 arereached.
10 How such small composition fluctuation leads to the Spinodal phase separation is today sand next two lectures topics. In comparison, if an alloy lies outside the Spinodal ( , with composition of X0 as shown) issolution treated at a high temperature T1, and then quenched to a lower temperature T2, smallvariations in composition lead to an increase in free energy (as shown), and the alloy is thereforemetastable. The free energy of the system cam only be decreased in this case if nuclei are formedwith a composition very different from the matrix. Therefore outside the Spinodal thetransformation must proceed by a process of nucleation and growth as we learned in the pastLectures < 0 c or X here refers to the concentration of components.