Transcription of Lecture 5 - Trace Elements in Seawater
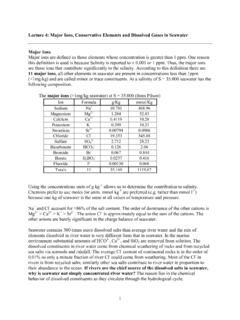
1 1 Lecture 5 - Trace Elements in Seawater Trace Elements Those Elements that do not contribute to the salinity. All Elements are present in concentrations less than 1mg kg-1 Many of these Elements are present at very low concentrations (as low as 10-21 M). 1 ppm is equivalent to 1oz of salt in 32 tons of potato chips! 1 ppb is like 1 drop of gin in 100,000 liters (back yard swimming pool) of tonic water. This presents analytical challenges to measure and avoid contamination. Why study Trace element distributions? 1. Many are nutrients and required to sustain life ( P, N, Fe, Cu) 2. Others are toxic ( Cu, Hg) 3. Some are tracers for redox conditions (Cr, I, Mn, Re, Mo, V, U) 4. Some form economic deposits such as manganese nodules ( Cu, Co, Ni, Cd) 5. Some are tracers of pollution ( Pb, Pu, Ag) A classic paper written in 1975 by Boyle and Edmond (Nature, 253, 107-109) on Trace metal chemistry of Cu represents a turning point in Trace element analysis; most data prior to that are suspected to be wrong due to analytical and contamination problems.
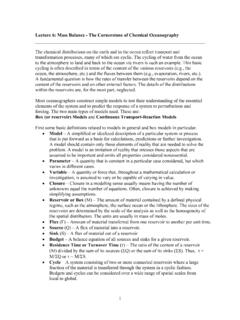
2 They suggest that data should be accepted only if it shows Oceanographic Consistency. Data must satisfy two criteria: Vertical profiles should be smooth. Correlations should exist with other Elements that share the same controlling mechanisms. Recycled Elements (also called Nutrient type or Biological) As the name suggests the distribution of these Elements is controlled by biological cycling. Typical profiles show depletion in the surface waters and increases with depth. Most of the marine life and certainly all the photosynthesizing organisms are confined to the upper 100 meters or so of the ocean (the photic zone). These phytoplankton uptake dissolved carbon and other nutrients in order to grow and produce organic matter and hard body parts. Therefore, such nutrients as phosphate, nitrate, dissolved silica and Trace metals that are either needed for metabolic pathways or taken by mistake ( Cd, Zn,) are deplete from surface water.
3 90% of the organic matter produced is recycled in the photic zone but the remaining 10% (of dead organisms and fecal matter) sinks into the deeper ocean, gets remineralized (bacterial oxidation or dissolution) and returns to the water column as dissolved inorganic compounds. The result is depletion of the dissolved recycled Elements in surface waters and enrichment at depth. Note the depth profiles for Elements related to the organic (soft parts, phosphate and nitrate) and those concentrated in hard parts (shells, silica) are different. This depends on the depth of highest remineralization (shallower for organic matter and deeper for the skeletal remains). The Elements whose concentrations in surface waters drop down to zero are considered bio-limiting, as they have the potential to limit biological productivity.
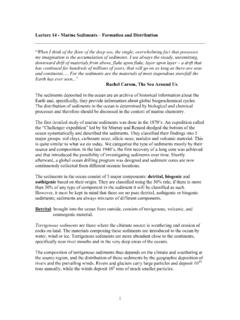
4 Others, like C, Sr, Ba and Ca are only partially depleted and are considered bio-intermediate. Many other Elements follow these types of curves because they adsorb or react with the organic or skeletal particles are recycled with them. Several of the most important Elements in living organisms (O, H, S and also C) are not limiting in the ocean. 2 Macronutrients There are many Elements required for life, but in oceanography, we speak of the main macronutrients as those major Elements that are believed to be limiting to plant growth in the surface ocean. They have typical concentrations in the range of micromoles kg-1. Phosphorus, nitrate and silica are the important macronutrients. The figures below for phosphate and silica show the different depth distributions. P and NO3 have maximum concentrations shallower than silica because maximum degradation of organic debris happens shallow in the thermocline.
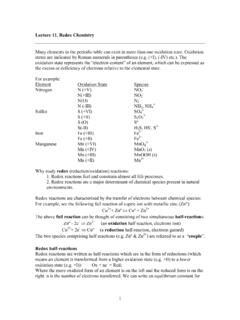
5 SiO2 increases with depth because of the dissolution of siliceous tests of diatoms, which dissolve deeper in the water column and on the sea floor. Bio-limiting Elements By definition, bio-limiting Elements are those necessary to sustain life and which may exist in low concentrations. These include the macronutrients; however, several Trace Elements can also be limiting, these are called micronutrients most notably is iron. Other metals like Cd, Zn, Ni, Cu, Se are depleted in surface waters and progressively enriched in deep waters. Concentrations of these metals correlate with those of the macronutrients. Some of these metals have biological functions, however others have no known biological function ( Cd) 3 Nutrient ConcentrationPacificRainingBioparticlesI ndianIdealized vertical section running from the Atlantic to Pacific(from Broecker, 1997)Water circulationAtlanticNADW020304001234 Depth, , Horizontal distributions Another characteristic of the distribution of the recycled Elements is the higher concentration in the deep Pacific relative to the deep Atlantic.
6 This is a result of the superposition of the vertical flux of biologically produced particles on the horizontal circulation of the ocean. The Elements accumulate during progressive regeneration and dissolution as the water mass ages and make its way along the conveyor belt. 4 Recycled Elements (Sr like Ca, C, and O are recycled, but their vertical distribution does not change much). Biologically Required Elements (H also needs to be included) 5 Scavenged Elements These Elements typically have depth profile that shows some decrease with depth. This is a result of adsorption of the ions or ionic complexes onto particle surfaces, such as clay minerals, organic matter, bacteria, fecal pellets etc. The concentration of particles is typically higher at the surface, resulting in effective adsorption of the scavenged Elements .
7 These Elements are very reactive and do not like to stay in solution, they thus have relatively short residence time (<100 years). For example, 137Cs, 95Zr and other nuclides from the Chernobyl nuclear incident in 1986 were stripped out of the water column within a month of the explosion. As the residence time of these Elements is shorter than the oceanic mixing time, it follows that their distribution reflects their source of origin. Accordingly, they display some variability in their profiles; following are some examples: Surface enrichment and depletion with depth, this distribution is at least partly because of dust input from the atmosphere. The metal is relatively unaffected by biological uptake, but adsorbs onto particles as they sink in the ocean causing a decrease in concentration with depth. Metals with this behavior include Pb, Sn, Co.
8 If an element is predominantly delivered via rivers or by release from shelf sediments, it can mix horizontally into surface waters leading to surface maxima in coastal areas examples for such Elements are Mn and 228Ra. Some Elements display surface enrichments due to in situ production in the euphotic zone mediated by biological reduction processes coupled with redox equilibration throughout the water column ( Cr3+, As3+, I-). Mid-depth minima, can result from a surface input coupled with regeneration near the sediment and scavenging throughout the water column (Cu). Mid-depth maxima can result from hydrothermal activity input (Mn and 3He). Maxima or minima within sub-oxic or anoxic layers can occur because of reduction processes either in the water column or in the adjacent slope sediments (a) maxima occur if the reduced element is more soluble (Mn2+) and minima if the reduced form is relatively insoluble or labile to become associated with solid phases (Cr3+).
9 Mixed Behavior Naturally, many metals exhibit behaviors that are a composite of the nutrient-like and scavenging categories, and some are difficult to understand. Two of these are aluminum and iron. The profile for Aluminum indicates surface enrichment from atmospheric input, and a decrease with depth and from the Atlantic to Pacific Ocean suggesting adsorption onto particles. 6 The increase with depth below 1000 m in the Atlantic may reflect a biological component that is overwhelmed in surface waters by the dust input or a source from the sediments. Other Elements have more complicated profiles. Of course, these profiles could only be taken as being representative as, by definition, the concentrations and distribution of these scavenged Elements would vary from place to place and in any one place with time.
10 The majority of the Trace Elements have residence times within the surface mixed layer (about 20 years) that are substantially shorter than the mean residence time of the water itself. Because of this, the distribution of the Trace Elements within the mixed layer is controlled by their input sources ( upwelling, river, or atmospheric input). This results in lateral differences in distribution. The distinction between conservative and non-conservative behavior depends on the extent to which an element participates in the biological or chemical reactions relative to its overall concentration (Mg and Cl participate but there is so much of them so the effect is negligible). It is important to remember that just because an element has some type of profile it does not mean that it is not involved in other processes.