Transcription of Lesson 8.1: Key Features of Polynomial Graphs Learning ...
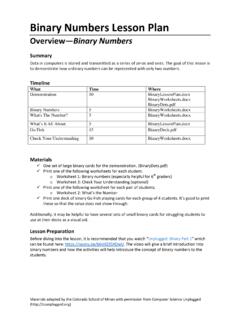
1 1 Lesson : Key Features of Polynomial Graphs Learning Goals: What are the key Features of the graph of a Polynomial function? Discovery: How does the highest degree of the Polynomial determine the shape of a graph? Degree = exponent 1. Sketch the graph of ( )= 2. What will the graph of ( )= 4 look like? Sketch it on the same coordinate plane. What will the graph of ( )= 6 look like? 2. Sketch the graph of ( )= 3. What will the graph of ( )= 5 look like? Sketch this on the same coordinate plane. What will the graph of ( )= 7 look like?
2 Sketch this on the same coordinate plane. 2 3. Consider the following functions ( ) and ( ), with a mixture of odd and even degree terms. Predict whether its end behavior will be like the functions in Example 1 or Example 2. Graph the function and using a graphing utility to check your prediction. ( )=2 4+ 3 2+5 +3 ( )=2 5 4 2 3+4 2+ +3 Summary of Odd/Even If the highest degree of the Polynomial is odd, the general shape of the graph will be as follows: 3 If the highest degree of the Polynomial is even, the general shape of the graph will be as follows: End Behavior: (Let be a function whose domain and range are subsets of real numbers.)
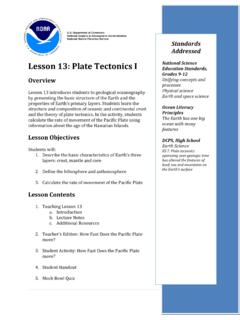
3 The end behavior of a function is a description of what happens to the values of the function o as approaches positive infinity, what do the -values approach? o as approaches negative infinity, what do the -values approach? 4 5 6 Exercise: For each graph given below: 1) determine whether it represents an odd-degree or an even-degree Polynomial ; 2) determine the sign of the leading coefficent (positive or negative); 3) describe the end behavior of each graph. 7 On what intervals is the function above increasing and decreasing? Decreasing: 2< <1 Increasing: < < 2 and 1< < 8 9 Exercise: Match each graph below with the given functions that it represents (no calculators).
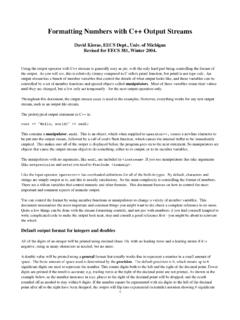
4 A. =3 3 b. =12 2 c. = 3 8 d. = 4 3+4 +2 e. 3 5 3+4 +2 Use these to help you: o Highest degree o End behavior o Leading coefficient (positive or negative) o -intercept Putting It All Together 1. The function = ( ) is shown below. Answer the following questions based on the graph: a) State the -intercepts and -intercepts of the function. -intercepts: 6 & 4 -intercepts: 2 b) State the domain and range of the function. Domain: ( ,+ ) Range: or ( ,8] c) State all the -coordinates of the relative maximums and relative minimums.
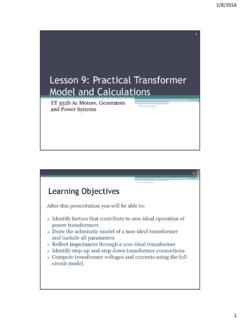
5 Relative Maximums: = 4 & 2 Relative Minimum: = 1 10 d) Over the interval, 1< <2, is ( ) increasing or decreasing? How can you tell? Graph goes up e) Over which interval(s), is ( ) decreasing? 4< < 1 or >2 f) What is the interval(s) for which ( )>0? What is a quick way of seeing this visually? 6< <4 if it is above the -axis then it is >0. g) Determine if is an odd or even Polynomial . Then determine if the sign of the leading coefficient is positive or negative. 2. Use the graph below to answer the given questions: a) Determine the -intercept(s) of the graph.
6 -intercepts: 4, 1,& 2 b) Determine the -intercept(s) of graph. -intercepts: 2 c) Describe the end behavior of the function. As , and As + , + d) Approximate the -coordinates of the relative maximums and relative minimums. Relative Maximum: Relative Minimum: .75 e) Determine the interval(s) where the function is increasing. < and >.75 f) What is the interval(s) for which ( )<0? What is a quick way of seeing this visually? < < 4 and 1< <2 if it is below the -axis then it is <0. g) Determine if the function is an odd or even Polynomial .
7 Then determine if the sign of the leading coefficient is positive or negative. 11 Homework : Key Features of Polynomial Graphs 1. The piecewise linear function ( ) is shown to the right. Answer the following questions based on its graph. (a) Evaluate each of the following based on the graph: (i) (4)= (ii) ( 3)= (b) State the zeros of ( ). (c) Over which of the following intervals is ( ) always increasing? (1) 7< < 3 (2) 3< <5 (3) 5< <5 (4) 5< <3 (d) State the coordinates of the relative maximum and the relative minimum of this function.
8 Relative Maximum: _____ Relative Minimum: _____ (e) Over which of the following intervals is ( )<0? (1) 7< < 3 (2) 2 7 (3) 5< <2 (4) 5 2 2. A continuous function has a domain of 7 10 and has selected values shown in the table below. The function has exactly two zeroes and a relative maximum at ( 4,12) and a relative minimum at (5, 6) (a) State the intervals on which ( ) is decreasing. (b) State the interval over which ( )<0. 12 3. For the function ( )=9 ( +1)2 do the following. (a) Sketch the graph of on the axes provided.
9 (b) State the zeros of . (c) Over what interval is ( ) decreasing? (d) Over what interval is ( ) 0? (e) State the range of . 4. Based on the graph of the function below, what are the values of for which ( ) is negative? (a) 6< <0 (b) 0< <6 (c) 6< <7 (d) 6< <6 (e) 6< <0 and 6< <7 5. The graph of = 4+10 3+10 2 96 + is shown below. Which of the following could be the value of ? (a) 3,240 (b) 1,080 (c) 72 (d) 72 (e) 3,240 13 Lesson 8. 2: Sketching a Polynomial in Factored Form Learning Goal: How do we sketch a Polynomial in factored form by using its characteristics?
10 Discovery: For any particular Polynomial , can we determine how many relative maxima or minima there are? Consider the following Polynomial functions in factored form and their Graphs . What observations can we make from this information? Looks like the degree of a Polynomial equals the number of -intercepts. Looks like the number of max/min is one less than the degree of the Polynomial . 14 Practice: Identify the following about the function below: location of the zeros, degree of the Polynomial , sign of the leading coefficient and end behavior: ( )= ( +2)( 1)( 3) = 2,1,3 Degree =3 Leading coefficient = 3 So it is negative, Odd end behavior: , and , Discovery: Is this true for every Polynomial ?