Transcription of LifeMode Group: Affluent Estates 1C Boomburbs
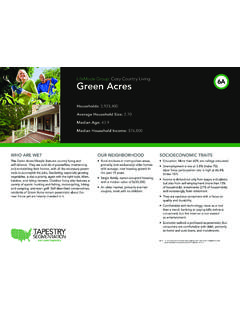
1 LifeMode Group: Affluent Estates 1C. Boomburbs Households: 2,004,400. Average Household Size: Median Age: Median Household Income: $113,400. WHO ARE WE? OUR NEIGHBORHOOD SOCIOECONOMIC TRAITS. This is the new growth market, with a profile similar to the Growth markets are in the suburban Well educated young professionals, original: young professionals with families that have opted periphery of large metropolitan areas. 55% are college graduates (Index 178). to trade up to the newest housing in the suburbs. The Young families are married with children Unemployment is low at (Index 61); original Boomburbs neighborhoods began growing in the (Index 220); average household size is high labor force participation at 1990s and continued through the peak of the housing boom.
2 (Index 114); most households have more Most of those neighborhoods are fully developed now. Home ownership is 84% (Index 134), with the highest rate of mortgages, than two workers (Index 124). This is an Affluent market but with a higher proportion of mortgages. Rapid growth still distinguishes the Boomburbs (Index 173). Longer commute times from the suburban neighborhoods, although the boom is more subdued now Primarily single-family homes, in new growth corridors have created more home than it was 10 years ago. So is the housing market. Residents neighborhoods, 66% built since 2000 workers (Index 156). are well-educated professionals with a running start (Index 441).
3 They are well connected: own the latest on prosperity. devices and understand how to use them Median home value is $350,000 (Index 169). efficiently; biggest complaints too many Lower housing vacancy rate at devices and too many intrusions on The cost of affordable new housing comes personal time. at the expense of one of the longest Financial planning is well under way commutes to work, over 30 minutes for these professionals. average, including a disproportionate TAPESTRY. TM. number ( ) commuting across county SEGMENTATION lines (Index 141). Note: The Index represents the ratio of the segment rate to the US rate multiplied by 100. Consumer preferences are estimated from data by GfK MRI.
4 LifeMode Group: Affluent Estates TAPESTRY. TM. 1C. Boomburbs SEGMENTATION. AGE BY SEX (Esri data) RACE AND ETHNICITY (Esri data) INCOME AND NET WORTH. The Diversity Index summarizes racial and ethnic diversity. The index Net worth measures total household assets (homes, vehicles, Median Age: US: shows the likelihood that two persons, chosen at random from the investments, etc.) less any debts, secured ( , mortgages). Indicates US $357,600. same area, belong to different race or ethnic groups. The index Esri Median Net Worth or unsecured (credit cards). Household income and &'$%45%6$7%)!"#$ Chart Title ranges from 0 (no diversity) to 100 (complete diversity).
5 Net worth are estimated by Esri. $93,300. 85+ Female Age 85+ !"#$%&'$%2+3. 80 84 Female Age 80-84 !"#$%&'$%2()2*$. Diversity Index: US: 75 79. 70 74. Female Age 75-79 !"#$%&'$%1+)1,$. Median Household Income Hispanic*. Female Age 70-74 !"#$%&'$%1()1*$. 65 69 Female Age 65-69 !"#$%&'$%0+)0,$. 60 64 Female Age 60-64 !"#$%&'$%0()0*$. $113,400. 55 59 Female Age 55-59 !"#$%&'$%++)+,$ Multiple Esri Median HH Income 50 54 Female Age 50-54 !"#$%&'$%+()+*$. $56,100. 45 49 Female Age 45-49 !"#$%&'$%*+)*,$. Other 40 44 Female Age 40-44 !"#$%&'$%*()**$. 35 39 Female Age 35-39 !"#$%&'$%/+)/, $. Asian and 0. $0. $100K. $100,000. $200K. $200,000. $300K $300,000. $400K.
6 $400,000. $500K. $500,000. $600K+. $600,000. 30 34 Female Age 30-34 !"#$%&'$%/()/*$. Pac. Islander Series2 Series1. 25 29 American Median Net Worth Female Age 25-29 !"#$%&'$%.+)., $. 20 24 Female Age 20-24 !"#$%&'$%.().*. Indian 15 19 Female Age 15-19 !"#$%&'$%-+)-, $. 10 14 Female Age 10-14 !"#$%&'$%-()-*. Black $357,600. 5 9 Female Age 5-9 !"#$%&'$%+), Esri Median Net Worth <5 Female Age 0-4 !"#$%&'$%()*. *"!# $ )"!# $ ("!# $ '"!# $ &"!# $ %"!# $ !"%!# $ White $93,300. 6$89$:. 6$89$:- Series2 Series1. 8% 4% 0 4% 8% 0 20% 40% 60% 80% 0 $100K $200K $300K $400K $500K $600K+. Male Female US Average. *Hispanic Can Be of Any Race. US Median. $113,400. Esri Median HH Income AVERAGE HOUSEHOLD BUDGET INDEX OCCUPATION BY$56,100.
7 EARNINGS. The index compares the average amount spent in this market's household budgets for The five occupations with the highest number of workers in the market are displayed $0 $100,000 $200,000. Series2. $300,000. Series1. $400,000 $500,000 $600,000. housing, food, apparel, etc., to the average amount spent by all US households. An index by median earnings. Data from the Census Bureau's American Community Survey. of 100 is average. An index of 120 shows that average spending by consumers in this market is 20 percent above the national average. Consumer expenditures are estimated by Esri. $140,000. Housing $120,000. Food Median Earnings $100,000. Apparel & Services $80,000.
8 Transportation Health Care $60,000. Entertainment & $40,000. Recreation Education $20,000. Pensions &. Social Security 0. Other 100,000 200,000 300,000 400,000 600,500,000. 0 50 100 150 200 250 300 350 Workers (Age 16+). LifeMode Group: Affluent Estates TAPESTRY. TM. 1C. Boomburbs SEGMENTATION. MARKET PROFILE (Consumer preferences are estimated from data by GfK MRI) HOUSING. Boomburbs residents prefer late model imports, primarily SUVs, and also luxury cars Median home value is displayed for markets that are primarily owner occupied; average rent is shown for renter-occupied markets. and minivans. Tenure and home value are estimated by Esri. Housing type and average Chart Title This is one of the top markets for the latest in technology, from smartphones to tablets rent are from the Census Bureau's American Community Survey.
9 To Internet connectable televisions. Style matters in the Boomburbs , from personal appearance to their homes. These consumers are still furnishing their new homes and already remodeling. They like to garden but more often contract for home services. Home Physical fitness is a priority, including club memberships and home equipment. Own Ownership Rent US Percentage: Leisure includes a range of activities from sports (hiking, bicycling, swimming, golf) Own to visits to theme parks or water parks. Typical Housing: Rent Residents are generous supporters of charitable organizations. Single Family Median Value: $350,000. US Median: $207,300. Own Rent POPULATION CHARACTERISTICS ESRI INDEXES.
10 Total population, average annual population change since Census 2010, and average Esri developed three indexes to display average household wealth, socioeconomic status, density (population per square mile) are displayed for the market relative to the size and housing affordability for the market relative to US standards. and change among all Tapestry markets. Data estimated by Esri. 900,000 Population 11,000,000. 6,536,700. 0 153 350. Wealth Index Population Growth (Annual %) 0 167 350. Socioeconomic Status Index 0 Population Density (Persons per sq. mile) 25,000. 1000 0 156 350. 1017 Housing Affordability Index LifeMode Group: Affluent Estates TAPESTRY.