Transcription of Making data count - improvement.nhs.uk
1 #plotthedots Making data count Start here#plotthedots2 Contents01 About this guide06 What does this guide do and who is it for?00 Foreword03 Introduction by Adam Sewell-Jones02 Nuts and bolts: the basics08 Making the case for better use of data14 Evidence, evidence, evidence17 Why analysts and decision-makers need to work together and how to do it04 Decision-makers70 Welcome to the decision-makers section77 Scenarios97 What next?98 Get involved!03 Analysts30 Welcome to the analysts section34 Supporting decision-makers37 Technical detail43 Scenarios68 What next?69 Get involved!05 Doing it together99 Plotting dots putting new knowledge into practice06 Train the trainer104 Group exercises07 Make your pledge113 Make your pledge08 Resources115 Resources118 Tools119 Useful websites/blogs121 Glossary123 Quiz3#plotthedots1 / 3 Decision-makersNuts and bolts: the basicsTrain the trainerResourcesForewordAnalystsDoing it togetherMake your pledgeAbout this guideForewordDuring my NHS career I have learnt a lot about how we can best use data to assist our decision- Making .
2 Many of us will have relied on comparing two points perhaps performance this month and last, or this year and last. But the problem with looking at two points of data is that it tells you nothing about trends and how much the data varies naturally. Statistical process control (SPC) is an analytical technique underpinned by science and statistics that plots data over time. It helps us understand variation and in so doing guides us to take the most appropriate action . Adam Sewell-Jones Executive Director of Improvement, NHS Improvement4#plotthedots2 / 3 Decision-makersNuts and bolts: the basicsTrain the trainerResourcesForewordAnalystsDoing it togetherMake your pledgeAbout this guideSPC is widely used in the NHS to understand whether change results in improvement and in industry for quality control. I would argue that SPC is one approach that we should increasingly use when considering our performance and operational data.
3 These are the reasons why: SPC alerts us to a situation that may be deteriorating SPC shows us if a situation is improving SPC shows us how capable a system is of delivering a standard or target SPC shows us if a process that we depend on is reliable and in will learn from this guide that there is strong evidence that better decisions are made when using SPC rather than simple techniques such as the popular RAG approach. This underpins the commitment in Developing People - Improving Care to ensure that the way in which we use data gives an adequate understanding of an organisation s trajectory of performance. Green can provide false assurance and mask deteriorating performance. The opposite may be true when seeing red .In his 2004 book Escape fire: Designs for the future of healthcare, Dr Donald Berwick states Plotting measurements over time turns out, in my view, to be one of the most powerful things we have for systemic learning.
4 5#plotthedots3 / 3 Decision-makersNuts and bolts: the basicsTrain the trainerResourcesForewordAnalystsDoing it togetherMake your pledgeAbout this guideYou may have heard that SPC is complicated the practical application of it is not. For many of you, understanding how to react to data is the most important thing, not the detail of the statistical rules that underpin may find that messages from this guide challenge your thinking and that of your colleagues. I encourage you to keep an open mind. The benefit you will gain from adopting our approach will be hope this guide will encourage many more people at all levels in the NHS from ward to board to make better use of data and to make data the presentation of data influences our decision Making Adam Sewell-Jones talks about how different presentations of data can lead to different conversations, conclusions and actions. He explains why it is important that NHS Boards in particular choose the best format of data presentation to inform their #plotthedotsForewordAbout this guideDecision-makersNuts and bolts: the basicsTrain the trainerResourcesAnalystsDoing it togetherMake your pledgeWhat does this guide do and who is it for?
5 What this document an interactive guide for people responsible for analysing, interpreting and presenting data to others (known as analysts) and decision-makers (managers and clinicians) who need data to answer describes why you should be presenting and using data more effectively and how to do it. It provides a toolkit for those wanting to make better judgements and decisions in healthcare. Case studies and exercises illustrate the different perspectives that clinicians, managers and analysts bring and show how closer working between these groups can add great value. This document contains links to useful videos, resources, tools and practical exercises. For those looking for further opportunities to collaborate and learn, we provide details of how to connect with the growing community who are doing just to Making data count , a guide that is designed to support people working in the NHS to make the best use of their data to inform judgements and decisions for #plotthedotsForewordAbout this guideDecision-makersNuts and bolts: the basicsTrain the trainerResourcesAnalystsDoing it togetherMake your pledgeHow to use this documentThe guide can be accessed in two ways.
6 You can dip in using the icons to identify the content you want to you can work your way through the guide choosing the path written for those with an analytical background/role or the one for those who instead have a decision- Making role. Or if you can find the time why not read the whole guide? In the last section, we include a range of activities to be done jointly by analysts and those of you needing to use data to make decisions. We hope you enjoy this guide; it owes a debt to extensive work by many previous NHS organisations and includes just a few examples of the exceptional work going on in the NHS. We hope it changes the way you look at data and incentivises you to ensure that connections are made between clinicians, managers and analysts to make better use of your organisation s your experiences of Making the best use of your data to support better judgement and decisions for action via Twitter using #plotthedotsVideo linkWeb linkExpand PledgeExercisesScenariosI pledge #plotthedotsForewordNuts and bolts: the basicsDecision-makersTrain the trainerResourcesAnalystsDoing it togetherMake your pledgeAbout this guideNuts and bolts.
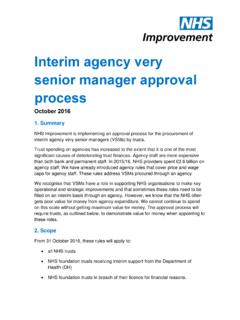
7 Making the case for better use of dataBefore we get into the detail, we d like you to gather together some colleagues and do an exercise that illustrates how the way data is presented can influence your decisions and tableTargetJan 2017 Feb 2017 Mar 2017 Apr 2017 May 2017 Jun 2017 Jul 2017 Aug 2017 Metric 1501001008310010010010067 Metric 2758684828275808181 Metric 39510099100100100100100100 Metric 4505757545653525555 Print out report 1 or gather around the screen and discuss this presentation of data. What do you think about this report? Is it a useful presentation of data? What kind of conversation did you have? What did it tell you? Importantly, what action would you take as a result of looking at it?9#plotthedotsForewordNuts and bolts: the basicsDecision-makersTrain the trainerResourcesAnalystsDoing it togetherMake your pledgeAbout this guideOkay, now let s move on to report Again, print this out or gather around the screen.
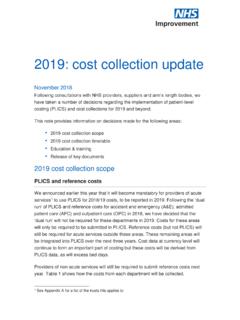
8 What do you think about this report? Is it a useful presentation of data? What kind of conversation did you have? What did it tell you? Importantly, what action would you take as a result of looking at it?10#plotthedotsForewordNuts and bolts: the basicsDecision-makersTrain the trainerResourcesAnalystsDoing it togetherMake your pledgeAbout this guide Do you often see data presented in either style? Which did you like/dislike? Which was the most useful? Which prompted the most useful conversation with your colleagues? Now take a few minutes to discuss these different #plotthedotsForewordNuts and bolts: the basicsDecision-makersTrain the trainerResourcesAnalystsDoing it togetherMake your pledgeAbout this guideReport 1 Did this feel like a sea of green and assure you that everything was okay? If you saw this in a 70-page performance report, how long would you spend considering it?
9 Busy decision-makers admit they often skip over data presented in this way. Why do you think they do this?Report 2 Did any of these graphs prompt more discussion and questioning? Did they provide you with assurance? What action would you take? Most people are concerned about the decline in indicator #plotthedotsForewordNuts and bolts: the basicsDecision-makersTrain the trainerResourcesAnalystsDoing it togetherMake your pledgeAbout this guideWould you be surprised to learn that both reports use the same data source?Did you notice the decline in indicator 2 in the sea of green ?Report 1 Did this feel like a sea of green and assure you that everything was okay? If you saw this in a 70-page performance report, how long would you spend considering it?Busy decision-makers admit they often skip over data presented in this way. Why do you think they do this?
10 Report 2 Did any of these graphs prompt more discussion and questioning? Did they provide you with assurance? What action would you take? Most people are concerned about the decline in indicator #plotthedotsForewordNuts and bolts: the basicsDecision-makersTrain the trainerResourcesAnalystsDoing it togetherMake your pledgeAbout this guideThe time series is longer in report 2 and because of this you can appreciate how variable performance is over time. These charts are SPC charts. A bit later we look at the anatomy of a SPC chart but for now, take a few minutes to consider whether even without understanding the detail of what a SPC chart is you would have taken action if presented with this style of graph. Share your thoughts with us on Twitter using the #plotthedots this example you should appreciate that how we visualise data is just as important as what we visualise if we want to make the most informed you surprised at the different conversations you had about the same data?