Transcription of Marginal Revenue, Marginal Cost, and Profit Maximization
1 Chapter 81 2005 Pearson Education, revenue , Marginal Cost, and Profit Maximization pp. 262-8 We can study Profit maximizing output forany firm, whether perfectly competitive ornot Profit ( ) = Total revenue - Total Cost If q is output of the firm, then total revenue isprice of the good times quantity Total revenue (R) = PqChapter 82 2005 Pearson Education, revenue , Marginal Cost, and Profit Maximization pp. 262-8 Costs of production depends on output, q Total Cost (C) = C(q) Profit for the firm, , is differencebetween revenue and costs)()()(qCqRq = Chapter 83 2005 Pearson Education, revenue , Marginal Cost, and Profit Maximization pp. 262-8 Firm selects output to maximize thedifference between revenue and cost We can graph the total revenue and totalcost curves to show maximizing profitsfor the firm Distance between revenues and costsshow profitsChapter 84 2005 Pearson Education, revenue , Marginal Cost, and Profit Maximization pp.
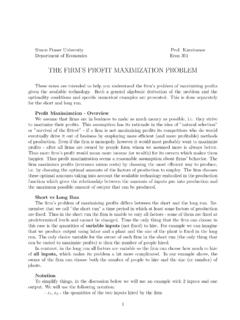
2 262-8 revenue is a curve, showing that a firm canonly sell more if it lowers its price Slope of the revenue curve is the marginalrevenue Change in revenue resulting from a one-unit increasein output Slope of the total cost curve is Marginal cost Additional cost of producing an additional unit ofoutputChapter 85 2005 Pearson Education, Maximization Short Run , revenue , Profit ($s peryear)Output C(q)R(q)AB (q)q0q* profits are maximized where MR (slopeat A) and MC (slope at B) are equalProfits aremaximizedwhere R(q) C(q) ismaximizedChapter 86 2005 Pearson Education, revenue , Marginal Cost, and Profit Maximization pp. 262-8 If the producer tries to raise price, sales arezero Profit is negative to begin with, since revenue isnot large enough to cover fixed and variablecosts As output rises, revenue rises faster than costsincreasing Profit Profit increases until it is maxed at q* Profit is maximized where MR = MC or whereslopes of the R(q) and C(q) curves are equalChapter 87 2005 Pearson Education, revenue , Marginal Cost, and Profit Maximization pp.
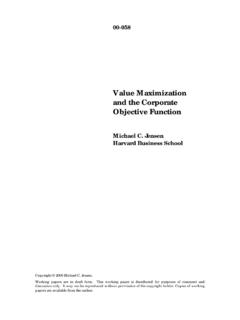
3 262-8 Profit is maximized at the point at whichan additional increment to output leavesprofit unchanged =R C q= R q C q=0MR MC=0MR=MCChapter 88 2005 Pearson Education, revenue , Marginal Cost, and Profit Maximization pp. 262-8 The Competitive Firm Price taker market price and outputdetermined from total market demand andsupply Market output (Q) and firm output (q) Market demand (D) and firm demand (d)Chapter 89 2005 Pearson Education, Competitive Firm pp. 262-8 Demand curve faced by an individual firmis a horizontal line Each firm is so small that its sales have noeffect on market price. As a result, eachregards market price as given. Demand curve faced by whole market isdownward sloping Shows amount of goods all consumers willpurchase at different pricesChapter 810 2005 Pearson Education, Competitive Firm pp.
4 262-8d$4 Output (bushels)Price$ per bushel100200 FirmIndustryD$4 SPrice$ per bushelOutput (millions of bushels)100 Chapter 811 2005 Pearson Education, Competitive Firm pp. 262-8 The competitive firm s demand Individual producer sells all units for $4regardless of that producer s level of output MR = P with the horizontal demand curve For a perfectly competitive firm, profitmaximizing output occurs whenARPMRqMC===)(Chapter 812 2005 Pearson Education, Maximization Short Run , revenue , Profit ($s peryear)Output C(q) (q)q* profits are maximized where MR=p andMC are equalProfits aremaximizedwhere R(q) C(q) ismaximizedR(q)=pqChapter 813 2005 Pearson Education, Output: Short Run pp. 268-73 In the short run, capital is fixed and a firmmust choose levels of variable inputs tomaximize profits We can look at the graph of MR, MC,ATC and AVC to determine profitsChapter 814 2005 Pearson Education, Competitive Firm pp.
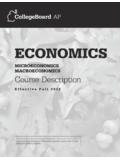
5 268-7310203040 Price50 MCAVCATC01234567891011 Outputq*AR=MR=PAq1 : MR > MCq2: MC > MRq*: MC = MR q1 Lost Profitfor q2>q*Lost Profitfor q2>q*Chapter 815 2005 Pearson Education, Output: Short Run pp. 268-73 The point where MR = MC, the profitmaximizing output is chosen MR = MC at quantity, q*, of 8 At a quantity less than 8, MR > MC, so moreprofit can be gained by increasing output At a quantity greater than 8, MC > MR,increasing output will decrease profitsSee also Fig. 8-8 on p. 275 of the text for anexample of actual MC 816 2005 Pearson Education, Competitive Firm PositiveProfits pp. 268-7310203040 Price5001234567891011 Outputq2 MCAVCATCq*AR=MR=PAq1 DCBP rofits aredeterminedby output perunit timesquantityProfit perunit = P-AC(q) =A to BTotalProfit =ABCDC hapter 817 2005 Pearson Education, Competitive Firm pp.
6 268-73 A firm does not have to make profits It is possible a firm will incur losses if theP < AC for the Profit maximizing quantity Still measured by Profit per unit timesquantity Profit per unit is negative (P AC < 0)Chapter 818 2005 Pearson Education, Competitive Firm Losses pp. 268-73 PriceOutputMCAVCATCP = MRDAt q*: MR =MC and P <ATCL osses =(P- AC) x q*or ABCDq*ABCC hapter 819 2005 Pearson Education, Run Production pp. 268-73 Why would a firm produce at a loss?Leave as your exercise! Might think price will increase in near future Shutting down and starting up could becostly Firm has two choices in short run Continue producing Shut down temporarily Will compare profitability of both choicesChapter 820 2005 Pearson Education, Run Production pp.
7 268-73 When should the firm shut down? If AVC < P < ATC, the firm should continueproducing in the short run Can cover all of its variable costs and some ofits fixed costs If P< AVC< ATC, the firm should shut down Cannot cover its variable costs or any of itsfixed costsChapter 821 2005 Pearson Education, Competitive Firm Losses pp. 268-73 PriceOutputP < ATC but AVC sofirm willcontinue toproduce inshort runMCAVCATCP = MRDq*ABCL ossesEFChapter 822 2005 Pearson Education, Firm Short RunSupply pp. 273-6 Supply curve tells how much output willbe produced at different prices Competitive firms determine quantity toproduce where P = MC Firm shuts down when P < AVC Competitive firms supply curve is portionof the Marginal cost curve above theAVC curveChapter 823 2005 Pearson Education, Competitive Firm sShort-Run Supply Curve pp.
8 273-6 Price($ perunit)OutputMCAVCATCP = AVCP2q2 The firm chooses theoutput level where P = MR = MC,as long as P > is MCabove AVCC hapter 824 2005 Pearson Education, Competitive Firm sShort-Run Supply Curve pp. 273-6 Supply is upward sloping due todiminishing returns Higher price compensates the firm for thehigher cost of additional output andincreases total Profit because it applies toall unitsChapter 825 2005 Pearson Education, Competitive Firm sShort-Run Supply Curve pp. 273-6 Over time, prices of product and inputscan change How does the firm s output change inresponse to a change in the price of aninput? We can show an increase in Marginal costsand the change in the firm s output decisionsChapter 826 2005 Pearson Education, cost increases and MC shifts to MC2and q falls to Response of a Firm toa Change in Input Price pp.
9 273-6 Price($ perunit)Output$5 Savings to the firmfrom reducing outputChapter 827 2005 Pearson Education, Market Supply Curve pp. 276-81 Shows the amount of product the wholemarket will produce at given prices Is the sum of all the individual producersin the market We can show graphically how we cansum the supply curves of individualproducersChapter 828 2005 Pearson Education, Supply in the ShortRun pp. 276-81$ perunitMC1 SSThe short-runindustry supply curveis the horizontalsummation of the supplycurves of the 829 2005 Pearson Education, surplusis area above MCto the priceProducer Surplus for a Firm pp. 276-81 Price($ perunit ofoutput)OutputAVCAVCMCMCAABBPPqq**At q* MC = 0 and q, MR > MC for all 830 2005 Pearson Education, Surplus in the ShortRun pp.
10 276-81 Price is greater than MC on all but the last unit ofoutput Therefore, surplus is earned on all but the last unit The producer surplus is the sum over all unitsproduced of the difference between the marketprice of the good and the Marginal cost ofproduction ( It indicates a firm s gains fromtrade.) Area above supply curve to the market priceChapter 831 2005 Pearson Education, Short-Run Market SupplyCurve pp. 276-81 Sum of MC from 0 to q*, it is the sum ofthe total variable cost of producing q* Producer Surplus can be defined as thedifference between the firm s revenueand its total variable cost We can show this graphically by therectangle ABCD revenue (0 ABq*) minus variable cost(0 DCq*)Chapter 832 2005 Pearson Education, surplusis also ABCD = revenue minusvariable costsProducer Surplus for a Firm pp.