Transcription of Marmot Indicators Briefing 18 July 2017 updated - IHE
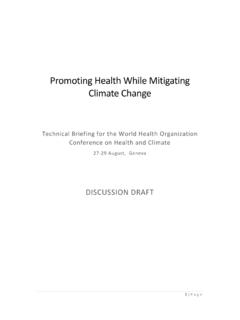
1 Marmot Indicators Briefing , EMBARGO: 0001 HRS TUESDAY 18TH JULY Squeezes on health services and rise in dementia deaths as life expectancy increases falter Improvements in life expectancy at birth, which had been around a one- year increase every five years for women and every three and a half years for men, have slowed since 2010 to a one- year increase every 10 years for women and every six years for men. Life%expectancy%at%birth,%England,%. 200072015%. Figures%based%on%. NaAonal%Life%tables%using%. single%years%of%age%. Source:%O ce%for%NaAonal%StaAsAcs%. %. Contact: Felicity Porritt Tel: 07739419219 Marmot Indicators Briefing , EMBARGO: 0001 HRS TUESDAY 18TH JULY Similarly increases in remaining life expectancy at age 65, which had been increasing at a rate of one year every six years for women and every five years for men, has slowed to a one year increase every 16 years for women and every nine years for men. There are many potential explanations for this reduced level of improvement in this key indicator.
2 However a key factor is the increasing role played by deaths at older ages. Three out of four deaths to women are at ages 75 and over, with two thirds of these occurring at ages 85 and over. For men, the respective figures are three out of five deaths are at ages 75 and over and half of these are at ages 85 and over. There has been a sudden and sustained increase in numbers of people at these older ages. This is both as a result of improved survival to old age and because of demographic and health events in the 1920s and 30s (the post war baby boom in the early 1920s followed by sustained levels of births and greatly improved chances of surviving infancy and childhood). This has placed substantial pressures on all forms of social protection, such as health , social care, and pensions. At the same time there has been an increase in the recognition of age- related degenerative mental health conditions (particularly dementia).
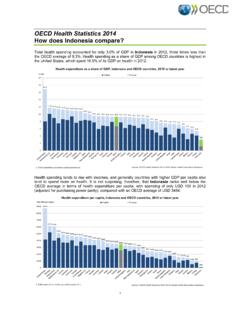
3 For example, the prime minister launched a national challenge to fight dementia in England in March 2012. Similarly a scheme offered a 55 payment to GPs for each dementia diagnosis made between 30 September 2014 and the end of March 2015. Furthermore, ONS made changes to the coding of deaths due to dementia so that prior to 2010, in around half of deaths that mentioned dementia it was coded as the underlying cause. From 2014, this figure rose to 70 per cent. However, dementia rates among those aged 85 and over had been rising since at least 2002, as a result of an increase in the rate at which dementia was certified as contributing to the cause of death by doctors. As a consequence of all these changes the category Dementia and Alzheimer's is the most common cause of death in women aged 80 and over (37,252 deaths) and in men aged 85 and over (12,258 deaths) at the most common ages at which people now die. Leading(causes(of(death(by(sex(and(.)))) )))
4 (age3group,(England(and(Wales,(2015! Age Males Females Cause Deaths Cause Deaths 01304 Congenital(malformaEons(etc 27 Congenital(malformaEons(etc 23. 05309 Congenital(malformaEons(etc 21 Malignant(neoplasm(of(brain( 13. 10314 Land(transport(accidents 15 Congenital(malformaEons(etc 12. 15319 Suicide(and(injury/poisoning(of(undeterm ined(intent 135 Suicide(and(injury/poisoning(of(undeterm ined(intent 51. 20324 Suicide(and(injury/poisoning(of(undeterm ined(intent 271 Suicide(and(injury/poisoning(of(undeterm ined(intent 68. 25329 Suicide(and(injury/poisoning(of(undeterm ined(intent 291 Suicide(and(injury/poisoning(of(undeterm ined(intent 93. 30334 Suicide(and(injury/poisoning(of(undeterm ined(intent 343 Suicide(and(injury/poisoning(of(undeterm ined(intent 98. 35339 Accidental(poisoning 377 Malignant(neoplasms(of(breast 146. 40344 Suicide(and(injury/poisoning(of(undeterm ined(intent 427 Malignant(neoplasms(of(breast 270. 45349 Ischaemic(heart(diseases 726 Malignant(neoplasms(of(breast 478.)))))))))))))))))))))))))))))))))))) ))))))))))))))))))))))))))))))))))))))))
5 50354 Ischaemic(heart(diseases 1,271 Malignant(neoplasms(of(breast 729. 55359 Ischaemic(heart(diseases 1,756 Malignant(neoplasms(of(breast 741. 65369 Ischaemic(heart(diseases 3,628 Malignant(neoplasm(of(trachea((bronchus( and(lung 2,079. 70374 Ischaemic(heart(diseases 4,305 Malignant(neoplasm(of(trachea((bronchus( and(lung 2,310. 75379 Ischaemic(heart(diseases 5,473 Ischaemic(heart(diseases 2,742. 80384 Ischaemic(heart(diseases 6,332 DemenEa(and(Alzheimer(disease( 6,588. 85+(( DemenEa(and(Alzheimer(disease( 12,248 DemenEa(and(Alzheimer(disease( 30,664. Source:(O ce(for(NaEonal(StaEsEcs(. Contact: Felicity Porritt Tel: 07739419219 Marmot Indicators Briefing , EMBARGO: 0001 HRS TUESDAY 18TH JULY Between 2002 and 2015, there was around 175% increase in dementia as contributing to the cause of death in women aged 85 and over and a 250% increase for men. While the largest contributor to this (particularly among women) was the increase in the rate of identifying dementia in the population, there were also substantial increases as a result of the larger population at older ages (and, separately, the combined effect of having a higher rate in a substantially increased population).)))))))))))))))))))))))))))) )))))))))))))))))))))))))
6 Based on current ONS coding rules, the increases in deaths identified as being caused by dementia ( underlying cause) were similar. The implications for services of both a greater rate of dementia at death and a relatively rapid increase in the population at the most vulnerable ages is considerable. All social protection activities are placed under considerable strain. Although resources in health and social services have, in many areas, been maintained at previous levels (in contrast to cuts in other services), the pressures identified here suggest that standing still is not a sufficient response. Inequalities within and between local authorities Inequalities within and between local authorities have persisted. Life expectancy for men varied from 74 in Blackpool to 83 in Kensington and Chelsea a nine- year gap. Among women it varied from 79 in Manchester to 86 in Kensington and Chelsea a seven- year gap. Within local authorities there was considerable variation in the inequality gradient in life expectancy between small areas based on level of deprivation.
7 For men, in Barking and Dagenham these inequalities were equivalent to slightly less than a three year gap while in Blackpool, Stockton on Tees and Kensington and Chelsea the figures were in the region of 14 to 15 years. Similarly for women, the inequality gradient varied from less than two years in Islington to 12 years or more in Stockton on Tees and Middlesborough. Despite these notable exceptions, there was generally a strong relationship the lower the level of life expectancy for the local authority, the steeper the inequality gradient within an authority. Contact: Felicity Porritt Tel: 07739419219 Marmot Indicators Briefing , EMBARGO: 0001 HRS TUESDAY 18TH JULY Healthy life expectancy for a local authority was similarly strongly related to life expectancy, with one principal exception. In Tower Hamlets, the gap between healthy life expectancy and life expectancy ( years spent in ill- health ) was considerably greater than that for other local authorities (30 years for females and 24 years for males).
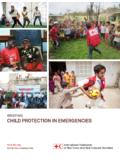
8 Male%life%expectancy%at%birth%and% health y%. life%expectancy%by%local%authority%%. Contact: Felicity Porritt Tel: 07739419219 Marmot Indicators Briefing , EMBARGO: 0001 HRS TUESDAY 18TH JULY Female&life&expectancy&at&birth&and&. healthy&life&expectancy&by&local&authori ty&&. Key Findings across the Social Determinants of health Early years development: impressive improvements and clear opportunities to reduce inequalities Good early years development has profound and lasting impacts on prospects and health in later life. Latest figures on early child development at age 5 illustrate impressive improvement. In 2012/13 only half of children reached a good level of development, and a third of children eligible for free school mealsi reached a good level of development. In 2015/16, just under 70% reached a good level of development and over half of children on free school meals reached this level. The gap has reduced slightly but not significantly.
9 However we know that there are areas where children on free school meals are doing much better, over 67% of those on free school meals in Haringey, Lewisham, Bexley and Greenwich reached a good level of development in 2015/16, whereas less than 40% reached a good level of development in Stockton on Tees, Blackburn and Darwen and Leicestershire. Clearly there is much to be learned from areas doing well. Contact: Felicity Porritt Tel: 07739419219 Marmot Indicators Briefing , EMBARGO: 0001 HRS TUESDAY 18TH JULY A. Give'every'child'the'best'start'in'life ''. Percentage&of&children&reaching&a&. %" good&level&of&development&at&age&5&. 80". 70". GAP". 60" Good&level&of&Development&and&eligible&f or&FSM&. 50" &. 40". >67%&Haringey,&Lewisham,&Bexley,&Greenwi ch&. 30". &. 20". 2012/13""" " ,&Blackburn&and&Darwen,&&. 2013/14""" " and&Leicestershire&&. 10" 2014/15""" ". &. 0" 2015/16"" ". ". 2012/13& 2013/14& 2014/15& 2015/16&. All& Free&School&Meal&Eligibility&.
10 GOOD" But"room"for"improvement". GCSE attainment stalled progress and clear opportunities to reduce inequality Inequalities can be reduced if we ensure that everyone makes the most of their capabilities. One aspect of this is to ensure that at school, inequalities in attainment are minimised. There was little change in the percentages attaining five or more GCSE's including English and Maths, or in the gap between all children and those eligible for free school meals between 2013/14 and 2014/15. Just under 60% of all children attained 5 or more GCSEs, and a third eligible for free school meals attained 5 or more GCSEs. Contact: Felicity Porritt Tel: 07739419219 Marmot Indicators Briefing , EMBARGO: 0001 HRS TUESDAY 18TH JULY The Indicators illustrate wide variation between children eligible for free school meals by region. As with early years development, the London region had significantly reduced the gap in attainment by 2014/15.