Transcription of OECD Health Statistics 2014 How does China …
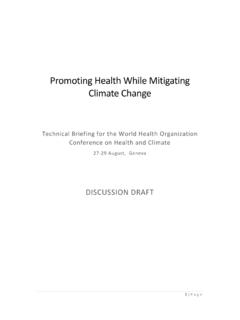
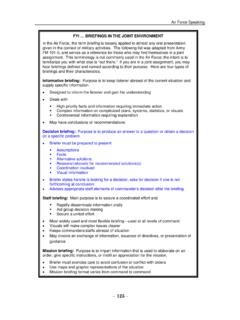
1 1 OECD Health Statistics 2014 How does China compare? Total Health spending accounted for of GDP in China in 2012, well below the OECD average of Health spending as a share of GDP among OECD countries is highest in the United States, which spent of its GDP on Health in 2012. Health expenditure as a share of GDP, China and OECD countries, 2012 or latest year GDP1. Total expenditure excluding capital : OECD Health Statistics 2014 ; WHO Global Health Expenditure Database Health spending tends to rise with incomes, and generally countries with higher GDP per capita also tend to spend more on Health . It is not surprising, therefore, that China ranks also below the OECD average in terms of Health expenditure per capita, with spending of USD 480 in 2012 (calculated based on purchasing power parity), compared with an OECD average of USD 3484.
2 Health expenditure per capita, China and OECD countries, 2012 or latest year 8745614060805099489648114698460245784419 4288410639973890364935593536348432893209 3172299826672457240923042291210520771803 1577154014471048984480010002000300040005 0006000700080009000 PublicPrivateUS$ PPP per capitaSource: OECD Health Statistics 2014 ; WHO Global Health Expenditure Database 2 The public sector is the main source of Health funding in nearly all OECD countries. In China , 56% of Health spending was funded by public sources in 2012, much lower than the average of 72% in OECD countries. Health care resources and activities With physicians per 1000 population in 2012, China had much fewer doctors per capita than the OECD average ( physicians). The number of nurses per capita in China ( nurses per 1000 population in 2012) is also much lower than the OECD average ( nurses).
3 The average number of doctor consultations was five per person in China in 2012, slightly less than the OECD average of six to seven consultations per year. However, there are wide variations among OECD countries depending on the organisation of the Health system, with the number of doctor consultations ranging from three per year in some countries to thirteen in others such as Japan and Korea. Health status and risk factors Most countries have enjoyed large gains in life expectancy over the past decades, thanks to improvements in living conditions, public Health interventions and progress in medical care. Life expectancy at birth in China has increased by more than 30 years since 1960 to reach years in 2012, although it remains five years lower than the OECD average ( years). The infant mortality rate in China has fallen greatly over the past two decades, coming down from 42 deaths per 1000 live births in 1990 to 12 deaths in 2012.
4 Nonetheless, it remains higher than the OECD average of 4 deaths per 1000 births. The proportion of regular smokers among adults has shown a marked decline over the past two decades in many countries. The smoking rate in China stood at 24% in 2010, three percentage points higher than the OECD average of 21%. There is a huge gender gap in smoking rates between men and women in China : 45% of Chinese men reported smoking every day in 2010 compared to only 2% of Chinese women. Obesity rates have increased in recent decades in all OECD countries, although there are notable differences. The World Health Organization estimated that of men and of women were obese in China in 2008. This is a much lower rate than in most other OECD countries, but slightly higher than in Japan ( men and women in 2012) and Korea ( men and women also in 2012).
5 More information on OECD Health Statistics 2014 is available at For more information on OECD's work on China , please visit