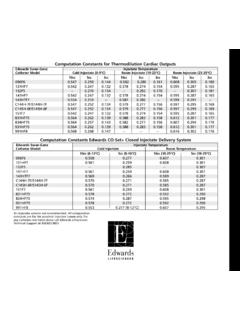
Transcription of Measuring Continuous Cardiac Output with the …
1 1 Measuring Continuous Cardiac Output with Measuring Continuous Cardiac Output with the FloTrac Sensor and Vigileo Monitorthe FloTrac Sensor and Vigileo MonitorEdwardsEdwardsFloTrac FloTrac SensorSensor& & EdwardsEdwardsVigileo Vigileo MonitorMonitor2 Topics System Configuration Physiological Principles pulse pressure relationship with stroke volume Calculating arterial pressure -Based Cardiac Output (APCO) Assessing pulse pressure Assessing patient specific effects of vascular tone Measuring CO Without a Manual Method of Calibration3 System ConfigurationVigileoMonitorPreSep Catheter(ScvO2)Venous OximetryVenous OximetryCardiacCardiacOutputOutputFloTra cSensor(peripheral artery)The Vigileo monitor by Edwards Lifesciences supports both the FloTrac Sensor for Continuous Cardiac Output and the PreSep central venous catheter for Continuous central venous oximetry (ScvO2)4 Vigileo Monitor Continuously computes stroke volume from the patients arterial pressure signal Displays key hemodynamic parameters on a Continuous basis (every 20 sec) Requires NO manual calibration The user simply enters patient age, gender, height and weight to initiate monitoring Advanced waveform analysis compensates for.
2 Patient-to-patient differences in vasculature Real time changes in vascular tone Differing arterial sites Venous oximetry available when used with appropriate Edwards oximetry technologyThe Vigileo monitor continuously displays and updates Continuous Cardiac Output , Cardiac Index, Stroke Volume, Stroke Volume Index, Systemic Vascular Resistance*, Systemic Vascular Resistance Index*, and Stroke Volume Variation every 20 seconds when used with the FloTrac sensor. DO2 and DO2I are also available for intermittent calculation.** These parameters help guide the clinician in optimizing stroke volume through precision guided management of preload, afterload, and tone = vessel compliance and resistanceThe Vigileo monitor then helps identify the adequacy of Cardiac Output by monitoring central venous (ScvO2) or mixed venous (SvO2) oxygen saturation when used with Edwards venous oximetry technologies.
3 * These parameters require the CVP value to be slaved from bedside monitor for Continuous monitoring. SVR/SVRI can also be assessed on the Derived Value Calculator for intermittent calculations using either slaved or manually entered MAP, CVP, and CO values.**These parameters require the SpO2 and PaO2 values to be manually entered. If CO is being continuously monitored, the calculator will default to the existing CO value. Otherwise, the user may override the Continuous value to manually enter specially designed FloTrac sensor provides the high fidelity arterial pressure signal required by the Vigileomonitor to calculate the stroke volumeThe Vigileo monitor uses the patient s arterial pressure waveform to continuously measure Cardiac Output .
4 With inputs of height, weight, age and gender, patient-specific vascular compliance is determined. The FloTrac sensor measures the variations of the arterial pressure which is proportional to stroke volume. Vascular compliance and changes in vascular resistance are internally compensated for. Cardiac Output is displayed on a Continuous basis by multiplying the pulse rate and calculated stroke volume as determined from the pressure waveform. The FloTrac sensor is easily setup and calibrated at the bedside using the familiar skills used in pressure does the FloTrac How does the FloTrac systemsystem s APCO s APCO algorithm work?algorithm work?( arterial pressure -based Cardiac Output )7 The Relationship of The Relationship of pulse pressure to Stroke VolumePulse pressure to Stroke Volume The difference between these two pressures [systolic and diastolic pressures].
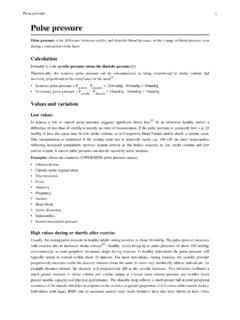
5 Is called the pulse pressure . - Guyton AC, Textbook of medical physiology, WB Saunders, 1991; 221-233. Aortic pulse pressure is proportional to SVand is inversely related to aortic compliance. - Boulain (CHEST 2002; 121:1245-1252) In general, the greater the stroke volume Output , the greater is the amount of blood that must be accommodated in the arterial tree with each heartbeat and, therefore, the greater the pressure rise and fall during systole and diastole, thus causing a greater pulse pressure . - Guyton AC, Textbook of medical physiology, WB Saunders, 1991; measurement algorithm starts with the premise that stroke volume is proportional to pulse pressure . We see from these references that the pulse pressure is simply the difference between systolic and diastolic pressure and that an increase in stroke volume will be shown by an increase in pulse pressure .
6 We also see that compliance will have an effect on pulse pressure . That is the greater the compliance for any given SV, the lesser the pulse .. pulse pressure is proportional to SV and is inversely related to aortic compliance. Boulain (CHEST 2002; 121:1245-1252)APCO = PR * SV Measures pulse rate Beats identified by upslope of waveforms pulse rate computed from time period of beats Based upon the basic physiological principle of pulse pressure s (PP) proportionality to SV sd(AP)* utilized to compute a robust assessment of key PP characteristics Computed on a beat by beat basissd(AP) * Compensates for differences in vascular tone (compliance and resistance) Patient-to-patient differences estimated from biometric data Dynamic changes estimated by data and waveform analysis* sd(AP) = standard deviation of arterial pressure , X (pronounced Khi ) sd(AP)
7 Cardiac Output is calculated by multiplying Heart Rate times Stroke APCO algorithm uses pulse Rate calculated from the arterial pressure Volume is calculated by multiplying the standard deviation of the arterial pressure sd(AP) signal against Khi (X).9 The calculation of pulse pressure The calculation of pulse pressure and its proportionality to SV: and its proportionality to SV: sd(AP)sd(AP)10 Trending Stroke Volume arterial pressure is sampled at 100 Hz Changes in stroke volume will result in corresponding changes in the pulse pressure A robust whole waveform measure of the pulse pressure is achieved by taking the standard deviation of the sampled points of each beat sd(AP) pulse pressure Stroke Volume SV estimates are calculated every 20 secPP SVSystolic pressure is sampled at 100 times per second (100 Hz).
8 Each sample is a pressure data point measured in mm Hg. This data is analyzed and updated every 20 seconds, utilizing the 2000 data points (20 sec x 100 Hz) standard deviation (sd(AP)) of these data points is proportional to the pulse pressure , which is proportional to the stroke method is robust in its assessment of pulse pressure because it looks at the whole (AP) = a measure of varianceThe Stroke Volume is averaged and displayed every 20 user has the capability to choose between a 20 second calculation or 5 minute moving average is a measure of variation of the APsd is a measure of variation of the APX timeX time AP Variation sd(AP) SVX timeTherefore, with a constant AP Variation sd(AP) SVThis graphic shows the relationship between varying arterial pulse pressure and stroke volume in the presence of a constant vasculature.
9 The sd(AP) is simply a statistical tool used in the algorithm for quantitatively assessing the magnitude of pulse pressure , correlated with an estimated stroke volume. Since we know that an individual s vasculature is not constant, an assessment of vascular tone must also be included in the calculation as it will affect the relationship between pulse pressure and stroke the effect of vascular Including the effect of vascular tone in the calculation of flow:tone in the calculation of flow:13 The Effect of Compliance on PP: Age, Gender and BSA factorsFor the same volume Younger Male Higher BSA Older Female Lower BSA Compliance inversely affects PP The algorithm compensates for the effects of compliance on PP based on age, gender, and is a direct relationship ( , the shape of the trend shown above) between arterial pressure and large vessel compliance as it relates to a human s age or gender.
10 That is, a male will typically have a more compliant aorta than a female of the same age, and a younger person will have a more compliant aorta than an elderly person. This relationship was quantified and mathematically modeled by Langewouters. Through development of the algorithm, it has also been found that there is a relationship between aortic compliance and BSA. For example, a larger person (higher BSA) will typically have more compliant vessels than a smaller person (lower BSA).As part of the assessment for vascular tone, estimates of aortic compliance based on the above principles are important but not all encompassing. Therefore, in addition to Langewouter s mathematical model, further waveform analysis is conducted by the algorithm to take into account patient specific, real time effects of vascular tone on the of Vascular ToneEffect of Vascular Tone The algorithm looks for characteristic changes in the arterial pressure waveform that reflect changes in tone ( , MAP, Skewness, Kurtosis) Those changes are included in the Continuous calculation of SkewnessMAPK urtosisThe aortic compliance function ( , age, gender, BSA function) within X helps to provide a ballpark estimate of the patient s likely vascular tone.