Transcription of METHOD 6010B INDUCTIVELY COUPLED PLASMA …
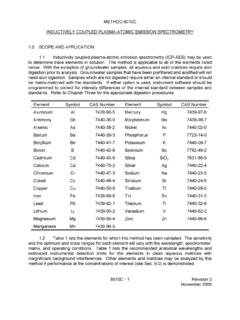
1 METHOD 6010B . INDUCTIVELY COUPLED PLASMA - atomic EMISSION SPECTROMETRY. SCOPE AND APPLICATION. INDUCTIVELY COUPLED PLASMA - atomic emission spectrometry (ICP-AES) determines trace elements, including metals, in solution. The METHOD is applicable to all of the elements listed in Table 1. All matrices, excluding filtered groundwater samples but including ground water, aqueous samples, TCLP and EP extracts, industrial and organic wastes, soils, sludges, sediments, and other solid wastes, require digestion prior to analysis. Groundwater samples that have been prefiltered and acidified will not need acid digestion. Samples which are not digested must either use an internal standard or be matrix matched with the standards. Refer to Chapter Three for the appropriate digestion procedures. Table 1 lists the elements for which this METHOD is applicable. Detection limits, sensitivity, and the optimum and linear concentration ranges of the elements can vary with the wavelength, spectrometer, matrix and operating conditions.
2 Table 1 lists the recommended analytical wavelengths and estimated instrumental detection limits for the elements in clean aqueous matrices. The instrument detection limit data may be used to estimate instrument and METHOD performance for other sample matrices. Elements and matrices other than those listed in Table 1. may be analyzed by this METHOD if performance at the concentration levels of interest (see Section ) is demonstrated. Users of the METHOD should state the data quality objectives prior to analysis and must document and have on file the required initial demonstration performance data described in the following sections prior to using the METHOD for analysis. Use of this METHOD is restricted to spectroscopists who are knowledgeable in the correction of spectral, chemical, and physical interferences described in this METHOD . SUMMARY OF METHOD . Prior to analysis, samples must be solubilized or digested using appropriate Sample Preparation methods ( Chapter Three).
3 When analyzing groundwater samples for dissolved constituents, acid digestion is not necessary if the samples are filtered and acid preserved prior to analysis. This METHOD describes multielemental determinations by ICP-AES using sequential or simultaneous optical systems and axial or radial viewing of the PLASMA . The instrument measures characteristic emission spectra by optical spectrometry. Samples are nebulized and the resulting aerosol is transported to the PLASMA torch. Element-specific emission spectra are produced by a radio-frequency INDUCTIVELY COUPLED PLASMA . The spectra are dispersed by a grating spectrometer, and the intensities of the emission lines are monitored by photosensitive devices. Background correction is required for trace element determination. Background must be measured adjacent to analyte lines on samples during analysis. The position selected for the background-intensity measurement, on either or both sides of the analytical line, will be determined by the complexity of the spectrum adjacent to the analyte line.
4 In one mode of analysis the position used should be as free as possible from spectral interference and should reflect the same change in background CD-ROM 6010B - 1 Revision 2. December 1996. intensity as occurs at the analyte wavelength measured. Background correction is not required in cases of line broadening where a background correction measurement would actually degrade the analytical result. The possibility of additional interferences named in Section should also be recognized and appropriate corrections made; tests for their presence are described in Section Alternatively, users may choose multivariate calibration methods . In this case, point selections for background correction are superfluous since whole spectral regions are processed. INTERFERENCES. Spectral interferences are caused by background emission from continuous or recombination phenomena, stray light from the line emission of high concentration elements, overlap of a spectral line from another element, or unresolved overlap of molecular band spectra.
5 Background emission and stray light can usually be compensated for by subtracting the background emission determined by measurements adjacent to the analyte wavelength peak. Spectral scans of samples or single element solutions in the analyte regions may indicate when alternate wavelengths are desirable because of severe spectral interference. These scans will also show whether the most appropriate estimate of the background emission is provided by an interpolation from measurements on both sides of the wavelength peak or by measured emission on only one side. The locations selected for the measurement of background intensity will be determined by the complexity of the spectrum adjacent to the wavelength peak. The locations used for routine measurement must be free of off-line spectral interference (interelement or molecular) or adequately corrected to reflect the same change in background intensity as occurs at the wavelength peak. For multivariate methods using whole spectral regions, background scans should be included in the correction algorithm.
6 Off-line spectral interferences are handled by including spectra on interfering species in the algorithm. To determine the appropriate location for off-line background correction, the user must scan the area on either side adjacent to the wavelength and record the apparent emission intensity from all other METHOD analytes. This spectral information must be documented and kept on file. The location selected for background correction must be either free of off-line interelement spectral interference or a computer routine must be used for automatic correction on all determinations. If a wavelength other than the recommended wavelength is used, the analyst must determine and document both the overlapping and nearby spectral interference effects from all METHOD analytes and common elements and provide for their automatic correction on all analyses. Tests to determine spectral interference must be done using analyte concentrations that will adequately describe the interference.
7 Normally, 100 mg/L single element solutions are sufficient; however, for analytes such as iron that may be found at high concentration, a more appropriate test would be to use a concentration near the upper analytical range limit. Spectral overlaps may be avoided by using an alternate wavelength or can be compensated by equations that correct for interelement contributions. Instruments that use equations for interelement correction require the interfering elements be analyzed at the same time as the element of interest. When operative and uncorrected, interferences will produce false positive determinations and be reported as analyte concentrations. More extensive information on interferant effects at various wavelengths and resolutions is available in reference wavelength tables and books. Users may apply interelement CD-ROM 6010B - 2 Revision 2. December 1996. correction equations determined on their instruments with tested concentration ranges to compensate (off line or on line) for the effects of interfering elements.
8 Some potential spectral interferences observed for the recommended wavelengths are given in Table 2. For multivariate methods using whole spectral regions, spectral interferences are handled by including spectra of the interfering elements in the algorithm. The interferences listed are only those that occur between METHOD analytes. Only interferences of a direct overlap nature are listed. These overlaps were observed with a single instrument having a working resolution of nm. When using interelement correction equations, the interference may be expressed as analyte concentration equivalents ( false analyte concentrations) arising from 100 mg/L of the interference element. For example, assume that As is to be determined (at nm) in a sample containing approximately 10 mg/L of Al. According to Table 2, 100 mg/L of Al would yield a false signal for As equivalent to approximately mg/L. Therefore, the presence of 10 mg/L of Al would result in a false signal for As equivalent to approximately mg/L.
9 The user is cautioned that other instruments may exhibit somewhat different levels of interference than those shown in Table 2. The interference effects must be evaluated for each individual instrument since the intensities will vary. Interelement corrections will vary for the same emission line among instruments because of differences in resolution, as determined by the grating, the entrance and exit slit widths, and by the order of dispersion. Interelement corrections will also vary depending upon the choice of background correction points. Selecting a background correction point where an interfering emission line may appear should be avoided when practical. Interelement corrections that constitute a major portion of an emission signal may not yield accurate data. Users should not forget that some samples may contain uncommon elements that could contribute spectral interferences. The interference effects must be evaluated for each individual instrument whether configured as a sequential or simultaneous instrument.
10 For each instrument, intensities will vary not only with optical resolution but also with operating conditions (such as power, viewing height and argon flow rate). When using the recommended wavelengths, the analyst is required to determine and document for each wavelength the effect from referenced interferences (Table 2) as well as any other suspected interferences that may be specific to the instrument or matrix. The analyst is encouraged to utilize a computer routine for automatic correction on all analyses. Users of sequential instruments must verify the absence of spectral interference by scanning over a range of nm centered on the wavelength of interest for several samples. The range for lead, for example, would be from to nm. This procedure must be repeated whenever a new matrix is to be analyzed and when a new calibration curve using different instrumental conditions is to be prepared. Samples that show an elevated background emission across the range may be background corrected by applying a correction factor equal to the emission adjacent to the line or at two points on either side of the line and interpolating between them.