Transcription of Methods of Particle Size Determination A Review
1 Methods of Particle size Determination A Review Innopharma Technology Ravenscourt Campus, 3rd Floor, Three Rock Road, Sandyford, Dublin 18, Ireland, D18 K599 Tel: +353 1 695 0162 Email: VAT: 9748673F, Reg. No. 473304 Page 2 of 25 Introduction .. 3 Eyecon2 .. 4 Principle .. 5 Correlation with Particle properties .. 6 Limitations .. 7 Sieve Analysis .. 8 Principle .. 8 Correlation with Particle Properties .. 8 Limitations .. 10 Laser Diffraction .. 11 Principle .. 11 Correlation with Particle Properties .. 14 Instrumentation Configuration .. 16 Limitations .. 17 Dynamic Light Scattering .. 18 Principle .. 18 Correlation with Particle properties .. 20 Determination of Mass and Volume .. 21 Instrumentation Configuration .. 22 Limitations .. 23 Bibliography & Further Reading .. 24 For More Information on Eyecon2 Please 24 Innopharma Technology Ravenscourt Campus, 3rd Floor, Three Rock Road, Sandyford, Dublin 18, Ireland, D18 K599 Tel: +353 1 695 0162 Email: VAT: 9748673F, Reg.
2 No. 473304 Page 3 of 25 Introduction The analysis of particles and characterisation of their size and shape is of great importance in a number of industries including food, construction, biopharma and pharmaceutical. The size of the granules that are used in the manufacture of capsules, tablets and effervescent tablets will have an effect on the disintegration rate, dissolution rate and the absorbance rate. There exists a number of Methods of determining Particle size of which the most common include sieve analysis, laser diffraction, dynamic light scattering and direct imaging techniques. Frequently, the results of these Methods do not correlate well with each other when examining the same samples. This can be attributed to the differences in the fundamental measurement principles used by each method to determine Particle sizes. The fundamental operating principles of the Methods of direct imaging sieve analysis, laser diffraction and dynamic light scattering are presented here in an effort to gain an understanding of the difference of results as measured by each method.
3 The operating principles are discussed in terms of fundamental principles, correlation with Particle properties, instrument configuration and the limitations of each method. Innopharma Technology Ravenscourt Campus, 3rd Floor, Three Rock Road, Sandyford, Dublin 18, Ireland, D18 K599 Tel: +353 1 695 0162 Email: VAT: 9748673F, Reg. No. 473304 Page 4 of 25 Eyecon2 The Eyecon2 Particle characteriser is a direct imaging Particle size analyser that measures size and shape information of particles in the size range of 50 - 5500 m in real-time. The Eyecon2 is a non-destructive, non-product contact analytical instrument which can be used as a bench-top laboratory instrument and in-line as a process analytical technology. The method of direct imaging which is utilised by the Eyecon2 allows images of samples to be captured which convey surface morphology and reports shape information. The Eyecon2 is suitable for measurement of wet and dry powders and bulk solids.
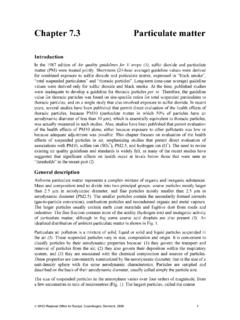
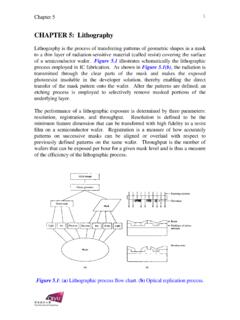
4 The Eyecon2 allows the tracking of Particle size growth and decrease in process as it continuously captures and processes data in real-time. Figure 2: The Eyecon2 Particle characteriser setup at-line Figure 1: The Eyecon2 Particle characteriser setup In-line on a GPCG30 Fluid bed Innopharma Technology Ravenscourt Campus, 3rd Floor, Three Rock Road, Sandyford, Dublin 18, Ireland, D18 K599 Tel: +353 1 695 0162 Email: VAT: 9748673F, Reg. No. 473304 Page 5 of 25 Principle The Eyecon2 calculates Particle size distributions based on the measurement of individual particles within a sample image. By utilising intense pulses of light from an array of front facing LEDs, particles which are moving up to 10 m/s can be captured by the camera sensor without the presence of motion artefacts. The LEDs pulse at high intensity every seconds illuminating the sample to be measured. The front facing direct illumination affords the ability to distinguish overlapping particles .
5 The camera sensor is synchronised with the pulsing of the LEDs to capture the sample material while it is illuminated. These captured images are then processed by the software EyePASS where the Particle detection algorithm identifies and measures individual particles within the captured image. Measurement data which is recorded and calculated by the Eyecon2 include the D10, D25, D50, D75, D90 as numeric and volumetric size with Mean and Median values all trended in real time with live histogram and S-curve results. Determination of the D-values is achieved by first fitting individual particles with an ellipse in order to determine the minimum and maximum diameter of the Particle , dmin and dmax. The magnitude of the 3rd dimension is predicted by the average of dmin and dmax to get davrg. The 3D volume of the ellipse which surrounds any Particle is calculated using the equation: The D-values computed by notionally arranging all particles measured in order of ascending volume.
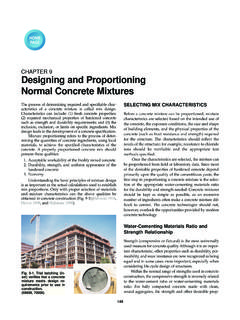
6 The total volume is computed first. An iterative algorithm then adds the volumes starting with the smallest and working up to the largest. The D10, D25, D50 etc. are the particles which corresponded to reaching 10%, 25% and 50% of the cumulative volume respectively. All recorded data is analysed in real-time to determine the overall process D-values based on the data captured throughout the whole recording session. The process is explained in further detail in the Innopharma Technology paper titled Eyecon2 Explanation of D-Value Determination Method . Innopharma Technology Ravenscourt Campus, 3rd Floor, Three Rock Road, Sandyford, Dublin 18, Ireland, D18 K599 Tel: +353 1 695 0162 Email: VAT: 9748673F, Reg. No. 473304 Page 6 of 25 Correlation with Particle properties particles that are identified by the software EyePASS are fitted with an ellipse that is constructed based on an applied edge detection algorithm. Applying an ellipse to a Particle for the Determination of the volume based on the maximum and minimum diameter and average of the min and max will result in a tighter, typically smaller volume fit than the cubed diameter of an equivalent circle fit to the same Particle .
7 This allows the Eyecon2 to more accurately calculate Particle volume which will affect the subsequently calculated D-Values. Figure 3: A Representation of the ellipsoid that is fitted to particles using the Eyecon2 software EyePASS compare to other Methods of Particle size detection. The eccentricity or shape of each Particle is calculated and is presented as an average eccentricity for the full recording session as well as the relative standard deviation of the eccentricity. Eccentricity can aid in blend uniformity and homogeneity analysis. Eccentricity is explained further in the Innopharma Technology paper titled Eyecon2/EyePASS Shape Measurement Method . A key advantage of front facing direct illumination compared to other direct imaging Methods that use a backlight is the ability to distinguish overlapping particles . Backlight imaging can silhouette multiple particles which are overlapping on the same axial plane as the light source which results in the erroneous identification of a larger Particle than is presented.
8 The Eyecon2 can correctly identify overlapping particles , the Particle at the forefront of the grouped particles will be analysed. particles whose boundaries are obscured will not be included for Particle sizing. This will reduce oversizing or under-sizing of Particle size measurement as a result of overlapping particles . Innopharma Technology Ravenscourt Campus, 3rd Floor, Three Rock Road, Sandyford, Dublin 18, Ireland, D18 K599 Tel: +353 1 695 0162 Email: VAT: 9748673F, Reg. No. 473304 Page 7 of 25 Limitations The Eyecon2, like all other Particle size measurement systems has areas in which it is not suitable to obtain highly accurate measurement results. Below are listed some of the areas in which the Eyecon2 is restricted from obtaining accurate and repeatable Particle size measurements. - Limits of detection of particles from 50 - 5500 m in size . - Difficulty in obtaining accurate measurement results of dark particles without algorithm optimisation by user.
9 This is a trial and error process and can take some time to optimise. - The Eyecon2 relies on direct illumination of sample for Particle identification within the algorithm and therefore transparent materials such as glass and some polymers cannot be accurately measured. - Highly reflective particles are difficult to measure due to reflections. - The focal length of the system is limited which means samples must be adequately close in order to appear in focus and measurable by the system. - The depth of field is small which means that material with a very wide sample range distribution will be difficult to measure at the extremes of the distribution curve. Innopharma Technology Ravenscourt Campus, 3rd Floor, Three Rock Road, Sandyford, Dublin 18, Ireland, D18 K599 Tel: +353 1 695 0162 Email: VAT: 9748673F, Reg. No. 473304 Page 8 of 25 Sieve Analysis Sieve analysis is a method of determining the Particle size distribution of a material.
10 The process separates fine particles from more course particles by passing the material through a number of sieves of different mesh sizes, essentially fractioning particles within certain sieve bin sizes. This mass fraction of particles is measured and weighed so a cumulative distribution can be constructed. Sieve analysis is the most traditional and widely known method used to characterise Particle size distributions. There are 2 types of sieve analysis that can be carried out; wet sieving and dry sieving. Wet sieving is suitable for Particle sizes from 20 m up to 3mm while dry sieving is suitable for particles from 30 m up to 125mm. Principle The material to be analysed is vibrated through a series of sequentially decreasing sieves using a single, or combination of horizontal, vertical or rotational motion. particles under motion will eventually orientate to present their 2 smallest dimensions to the sieve mesh opening and pass to the next sieve of smaller nominal opening.