Transcription of ⅱ 研究人材 - mext.go.jp
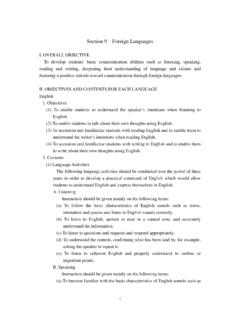
1 R&D personnel . Current status of S&T in Japan and other selected countries / R&D personnel 9 Researchers 9-1 . Trends in the number of researchers in selected countries . 10,000 persons EU-28(2015). 180 Japan Japan(FTE). (2015) United States 160 Germany EU-15(2015) France United Kingdom 140 EU-15. (2014) EU-28. China 120 Rep. of Korea Russian Federation India 100. 80.. 60. (2015) 40 (2015) (2015) (2015) (2015) 20 (2014) 0 ). 198182 83 84 85 86 87 88 89 90 91 92 93 94 95 96 97 98 99200001 02 03 04 05 06 07 08 09 10 11 12 13 14 15 16 year . 2006 .. 2001 4 1 2002 3 31 .. 1995 OECD .. 2008 OECD Frascati Manual .. 2000 OECD .. 1996 1998 2000 2002 2008 2010 2013 2014 2015 2015 .. 1983 .. 1999-2004 OECD .. 2005-2010 2012-2015 2013 2014 2015 .. EU OECD .. OECD, Main Science and Technology Indicators, Vol. 2017/6. : UNESCO Institute for Statistics S&T database OECD, Main Science and Technology Indicators, Vol.
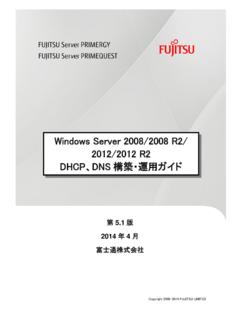
2 2017/6. 16-1 16-8 26-1-1 EU-15 26-2-1 EU-28 26-2-2 26-3-1 26-4-1 . 26-5-1 26-6-1 26-7-1 26-8-1 26-10. 46. 9 . Researchers 9-2 . Trends in the number of researchers per 10,000 people and per 10,000 labour force in selected countries 9-2-1 . Trends in the number of researchers per 10,000 people in selected countries ( ). persons ii Japan Japan(FTE). United States Germany (2015) 70 France United Kingdom EU-15 EU-28 China Rep. of Korea Russian Federation India 60. ( ). 50. (2015) (2015) (2014) 2014 40. EU-15(2014) EU-28(2014) (2015). 30. 20. (2015) 10. ( ). (2015) 0 ( ). 198182 83 84 85 86 87 88 89 90 91 92 93 94 95 96 97 98 99200001 02 03 04 05 06 07 08 09 10 11 12 13 14 15 16. year . 2006 .. 1 .. 2001 4 1 2002 3 31 .. 1995 OECD .. 2000 OECD .. EU OECD .. 1996 1998 2000 2002 2008 2010 2013 2014 2015 2013 2014 . 2015 .. 1983 .. 1999-2004 OECD .. 2005-2010 2012-201 2013 2014 2015.
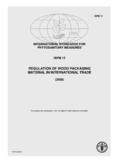
3 2008 OECD Frascati Manual . 10. 2005 .. OECD, Main Science and Technology Indicators, Vol. 2017/6. 10 1 . : UNESCO Institute for Statistics S&T database OECD, Main Science and Technology Indicators, Vol. 2017/6. 47.. Current status of S&T in Japan and other selected countries / R&D personnel 9-2-2 1 . Trends in the number of researchers per 10,000 labour force in selected countries ( ). persons 140. Japan Japan(FTE). (2015) United States Germany France United Kingdom 120 EU-15 EU-28. China Rep. of Korea Russian Federation ( ). 100 (2014). (2015) (2014) (2015) 80 EU-15(2015) EU-28(2015) 60 (2015) 40. 20 (2014) 0. 198182 83 84 85 86 87 88 89 90 91 92 93 94 95 96 97 98 99200001 02 03 04 05 06 07 08 09 10 11 12 13 14 15 16 ( ). year . 2006 .. 1 .. 2001 4 1 2002 3 31 .. 1995 OECD .. 2000 OECD .. EU OECD .. 1996 1998 2000 2002 2008 2010 2013 2014 2015 2013 2014 2015.
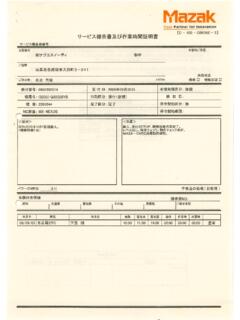
4 1983 . 1999-2004 OECD . 2005-2010 2012-2014 2013 2014 2015 .. 2008 OECD Frascati Manual .. OECD, Main Science and Technology Indicators, Vol. 2017/6. 10 . OECD, Main Science and Technology Indicators, Vol. 2017/6. 48. 9 . Researchers 9-3 . Composition of the number of researchers by research sector in selected countries . Country(year). 2016 . Japan . ( ). 2016 Japan(FTE).. ii 1999 . United States . 2015 . Germany . 2014 . France . 2015 . United Kingdom . EU-15 2015 .. EU-28 2015 .. 2015 . China . 2015 . Rep. of Korea . 2015 . Russian Federation . 2015 . India . 0 10 20 30 40 50 60 70 80 90 100 .. Government sector Higher education sector Business enterprise sector Private non-profit sector .. 2016 3 31 .. EU OECD .. : UNESCO Institute for Statistics S&T database OECD, Main Science and Technology Indicators, Vol. 2017/6. 29-1 16-9 26-1-5 26-2-5 26-3-5 26-4-5 26-5-5.
5 26-6-5 26-7-5 26-8-5. 49.. Current status of S&T in Japan and other selected countries / R&D personnel 9-4 . Trends in the number of researchers by research sector in Japan . 10,000 persons 100. Total Business enterprises 90. Non-profit institutions Public organizations 80 Universities and colleges 70. 60. 50. 40. 30. 20. 10. 0 .. 57 58 59 60 61 62 63 2 3 4 5 6 7 8 9 10 11 12 13 14 15 16 17 18 19 20 21 22 23 24 25 26 27 28. year 56 .. 3 31 13 4 .. 14 24 .. 24 14 23 13 .. 16-9. 50. 9 . Researchers 9-5 . Trends in the number of female researchers and female researchers as a percentage of total researchers in Japan head-counts . ( ). 10,000 persons ( ). 14 Female researchers Percentage of female researchers 14. 12 ii .. 12.. 10 .. 10 .. 8 .. 8 . Female . researchers . 6 .. 6.. Percentage 4 of 4. female researchers 2 2. 0 0.. 5 6 7 8 9 10 11 12 13 14 15 16 17 18 19 20 21 22 23 24 25 26 27 28.
6 Year . 4.. 3 31 13 4 1 .. 51.. Current status of S&T in Japan and other selected countries / R&D personnel 9-6 .. Trends in the number of doctoral researchers by kind of organization and doctoral researchers as a percentage of total researchers in Japan head- counts .. 10,000 persons percentage 20 20. 18 16 18. 14 12 16. 10. 8 14. 6 4 12. 2 0 10. 15 16 17 18 19 20 21 22 23 24 25 26 27 28.. 14 year .. 3 31 .. 24 .. 52. 9 . Researchers 9-7 Business enterprise researchers in Japan 9-7-1 28 . Composition of the number of business enterprises researchers by industry in Japan (2016).. percentage Information and communication electronics equipment, Other Industries, ii . Transportation equipment, Scientific and development research institutes, Drugs and medicines, . Business oriented machinery, Production machinery, . Electronic . parts, devices and Chemicals Electrical machinery, electronic circuits, products, equipment and supplies, 28 3 31.
7 17-6. 53.. Current status of S&T in Japan and other selected countries / R&D personnel 9-7-2 28 . Composition of the number of business enterprises researchers by field of science and specialty in Japan 2016 .. Medical science, Social sciences and Mathematics and humanities , percentage physics , . Agiricultural science , . Informaiton science , . Other engineering and technology, . Chemistry , Textile technology , . Biology , Material, Physical sciences . Geology , . Civil engineering and Other physical sciences , architecture , Total .. Engineering and technology Electrical engineering and . telecommunications Mechanical engineering engineering , ,shipbuilding and aeronautical engineering , .. 17-7. 54. 9 . Researchers 9-7-3 5 . 28 . Number of business enterprises researchers per 10,000 employees by industry (top five industrial categories ) in Japan (2016).
8 6,721. Scientific and development research institutes 2,426 ii Information and communication electronics equipment 1,961. Business oriented machinery 1,564. Electronic equipment and electric measuring 1,504. Oil and fat products and paints 888. All industries ( ). 0 1,000 2,000 3,000 4,000 5,000 6,000 7,000 8,000 persons 28 3 31 .. 55.. Current status of S&T in Japan and other selected countries / R&D personnel 9-8 . Non-profit institutions and public organizations researchers in Japan 9-8-1 . Trends in the number of non-profit institutions and public organizations researchers by kind of organization in Japan . 10,000 persons . Non-profit institutions . Public organization ( ). (National research institutions). ( ). (Local government-owned research institutions). ( ). (Public corporations and incorporated administrative agencies).. 57 58 59 60 61 62 63 2 3 4 5 6 7 8 9 10 11 12 13 14 15 16 17 18 19 20 21 22 23 24 25 26 27 28.
9 56 year . 3 31 13 4 1 .. 14 13 .. 13 .. 18-4. 56. 9 . Researchers 9-8-2 .. 28 . Composition of the number of non-profit institutions and public organizations researchers by kind of organization and field of science in Japan (head-counts). (2016).. Non-profit institutions ii . Public organizations . Central government-owned . Local government-owned .. Government-affiliated agencies and research institutions, and incorporated administrative agencies 0 10 20 30 40 50 60 70 80 90 100 ( ). percentage Physical sciences Engineering and technology . Agricultural sciences Medical sciences . Social sciences and humanities, sub-total . 28 3 31 .. 18-5. 57.. Current status of S&T in Japan and other selected countries / R&D personnel 9-9 . Universities and colleges researchers in Japan 9-9-1 . Trends in the number of universities and colleges researchers by kind of organization.
10 10,000 persons 18. National 16. Public Private 14. 12. 10. 8. 6. 4. 2. 0.. 57 58 59 60 61 62 63 2 3 4 5 6 7 8 9 10 11 12 13 14 15 16 17 18 19 20 21 22 23 24 25 26 27 28 . 56 year 3 31 13 4 1 .. 58. 9 . Researchers 9-9-2 . Trends in the number of regular researchers at universities and colleges by field of science ( ). 10,000 persons 35. Others Medical sciences Agricultural sciences 30 Engineering and technology Physical sciences . Social sciences and humanities Others ii 25.. Medical sciences 20.. Agricultural sciences 15 . Engineering and technology 10.. Physical sciences 5 . Social sciences and humanities 0. 2 3 4 5 6 7 8 9 10 11 12 13 14 15 16 17 18 19 20 21 22 23 24 25 26 27 28 ( ). year .. 3 31 13 4 1 .. 19-6. 59.. Current status of S&T in Japan and other selected countries / R&D personnel 9-9-3 . Trends in the number of regular researchers at universities and colleges by field of specialty Natural sciences and engineering only.