Transcription of Miami-Dade County Facts
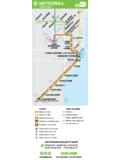
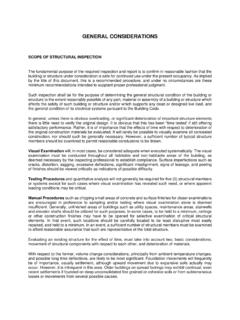
1 Miami-Dade County Facts NW 2ND AVE. LVD. I 75 EXT. E. AV. SR 826 EXT. NE B. E. 9. M. SR. O. KR. AY. G R ATIG. N. W N Y PK W. BISC. O Y. CO LL INS AV. KE. EC NW 119T H ST. HO. BE. E. NW 27TH AVE. RD. I 95 EX PY. KROME AVE. E. NE 79TH ST. FLORID A TPKE EXT. I 95 EXP Y. SR 826 EXT. N RD. SR 112. VE. I 195. NW 36TH ST. IN S A. ALTO. Population CO LL. E. SW 27TH AVE. AV. LL. SW 8TH ST. E. I CK. BR. KRO ME AVE SR 878. T. EX. 4. 87. Y. SR. HW. I XIE. SD. Housing SW 177TH AVE. N KROME AVE. Income SW 192ND AVE. SW 392ND ST. SW. CA. RD. SO. UN. Employment S D IX. D. RD. IE H W. INGRAHAM HWY. Y. Miami-Dade County Department of Planning & Zoning Planning Research Section 111 NW 1st Street Suite 1220.
2 miami , Florida 33128-1972. April, 2009. Miami-Dade County Facts - 2009. A Compendium of Selected Statistics Research Section Department of Planning and Zoning Stephen P. Clark Center st 111 l Street, Suite 1220. miami , Florida 33128-1972. 305-375-2845. This report is also available on the Department of Planning and Zoning web site. Table of Contents Introductory Material Page Map of Miami-Dade County 1. Map of Commission Districts 2. Map of Municipalities in Miami-Dade County 3. I. Population Resident Population, Miami-Dade County by Municipality, 1900-2007 4. Resident Population & Population Change, Miami-Dade County , 1900-2009 5.
3 Population Projections, Components of Change, Miami-Dade County , 1990 to 2030 6. Births and Deaths, Miami-Dade County , 1971-2007 7. Population by Race and Hispanic Origin, Miami-Dade County , 1930-2020 8. Population by Race and Hispanic Origin, miami MSA, 1960-2000 9. Map of Population Densities by Race and Ethnicity, 2000 10. Population by Race and Hispanic Origin, All Ages and 18 Years and Over, Miami-Dade County , 2000 11. Black Population, Miami-Dade County by Municipality, 2000 12. Black Population, Selected Cities, Miami-Dade County , 1950-2000 13. Map - Where Blacks Live - 2000 14. Hispanic Origin Population, Selected Metropolitan Areas in Florida, 1970, 1980, 1990 and 2000 15.
4 Municipal Population by Percent Hispanic, 1970, 1980, 1990 and 2000 16. Map - Where Hispanics Live - 2000 17. Population by Race and Hispanic Origin, Miami-Dade County by Municipality, 2000 18. Persons of Hispanic Origin by Country of Origin, (including Central and South America), Miami-Dade County , 19. Florida, 1990, 2000-2007. White Population, Miami-Dade County , 2000 20. Black Population, Miami-Dade County , 2000 20. Some Other Race Population, Miami-Dade County , 2000 21. Asian Population, Miami-Dade County , 2000 21. American Indian and Alaskan Native Population, Miami-Dade County , 2000 22. Native Hawaiian and Other Pacific Island Population, Miami-Dade County , 2000 22.
5 Percent Distribution of Population of Two or More Races, Miami-Dade County and the United States 23. Place of Birth for the Foreign-Born Population, Miami-Dade County , 2000 24. Population by Age, 1970, 1980, 1990 and 2000, Miami-Dade County 27. Population Under 18 Years and 65 Years and Over, Miami-Dade County by Municipality, 2000 28. Marital Status of Persons by Sex, 1970, 1980, 1990 and 2000 29. Households and Families by Type, 1980, 1990 and 2000 29. Land Area & Population Density by Acreage & Square Miles, Miami-Dade County by Municipality, 2007 30. Miami-Dade County Public Schools, Enrollment by Grade, 1996-97, 1997-98, 1998-99, 1999-00, 2000-01, 2001-02, 31.
6 2002-03, 2003-04, 2004-05, 2005-06, 2006-07, and 2007-08. Educational Attainment by Race and Hispanic Origin, Persons 25 Years Old and Over, 1970, 1980, 1990 and 2000 32. II. Housing Housing Units, 1960, 1970, 1980, 1990 and 2000, Miami-Dade County by Municipality 33. Selected Housing Characteristics, 1960, 1970, 1980, 1990 and 2000, Miami-Dade County , Florida 34. Home Sales - Single Family 1980-2004; Condominiums 1980-2004 35. Existng Unit Sales - Homes 1993-2008; Condominiums 2005-2008 35. Table of Contents (continued). III. Labor Force and Employment Page Nonagricultural Employment by Industry, miami - miami Beach-Kendall Metro Division 2003-2007 36.
7 Labor Force Status, Miami-Dade County , Florida 2003-2007 36. Number of Employees, Establishments, and Annual Payroll by Industry, 2006, Miami-Dade County 37. Miami-Dade County 's Ten Largest Private and Public Employers in 2008 38. Miami-Dade County 's Ten Largest Financial and Telecommunication Firms in 2008 38. Miami-Dade County 's Five Largest Biomedical Firms in 2008 38. Employment by Occupation, Miami-Dade County , 1970, 1980, and 1990 39. Employment by Occupation and Gender, Miami-Dade County , 2000 & 2007 39. Employment by Industry, Miami-Dade County , 1970, 1980, and 1990 40. Employment by Industry, Miami-Dade County 2000 & 2007 40.
8 IV. Income Personal Income by Major Source, 2001 - 2006 41. Earnings by Broad Industrial Sector, 2001 - 2006 41. Income Distribution, Families and Households, 1979, 1989, 1999, and 2007 43. Per Capita Personal Income, 1981-2006 (Current $) 43. V. Other Economic Informaton Electric Customers 1972-2008 44. Motor Vehicle License Tags 1973-2006 45. Passenger and Cargo - Port of miami and miami International Airport, 1971-2008 46. Florida Price Level Index for Selected Counties, 2003-2008 47. miami CMSA ( Miami-Dade County ) Consumer Price Index 1977-2008 48. Cost of Living Comparisons for the 15 Largest Metropolitan Areas, Third Quarter 2008 49.
9 Cost of Living Comparisons for the 15 Largest Counties, Third Quarter 2008 49. VI. Other Information Millages Applicable to Property Tax Assessments for 2008 50. Miami-Dade County Hospitals and Licensed Beds, 2008 51. Licensed Health Professionals, 1999 - 2007 52. Climate Characteristics, Miami-Dade County , Florida 2006 53. Parks and Recreational Areas, 2009 54. Inventory of Land Uses in Miami-Dade County , Inside and Outside the Urban Development Boundary (UDB), 2004, 2006, and 2008 55. Directory of Federal, State, County , Local and Private Agencies 56. NE 215TH ST. OCEAN BD. NW 215TH ST. W DIXIE HY.
10 NW 215TH ST. NW 207TH ST NW 207TH ST NE 205TH TE. NW 2ND AV. EX. NW 12TH AV. NW 202ND ST. TP NW 199TH ST 5. NW 7TH AV. I9. A. ID NW 191ST ST NE 185 TH ST. R. BD. O NW 186TH ST. NW 17TH AV. FL NW 183RD ST. COLL INS AV. NE 175T H ST. E. NW 178TH ST NW 175TH ST. AY N. DR. NW 17 3RD. I 75 EX. NW 2N. Development Boundaries NW 167TH ST SR 826 EX. BIS C. CT. AV. NW 67TH AV. NW 57TH AV. W. NE 10TH AV. E. NW 77 TH. 2015 URBAN DEVELOPMENT BOUNDARY O. M. NW 87TH AV. D AV. KE. NW 60T H AV. O. V X. NA 9E. I 95 EX. KR. NE 6TH AV. EC. N. 2025 EXPANSION AREA BOUNDARY HO JA SR. N. BE NE 135T H ST. NW 92ND AV. E NW 135TH ST.