Transcription of MIAMI-DADE COUNTY PUBLIC SCHOOLS STANFORD …
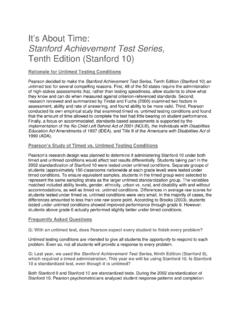
1 MIAMI-DADE COUNTY PUBLIC SCHOOLS STANFORD achievement TEST, TENTH EDITION SUBTESTS AND CONTENT CLUSTER ANALYSIS RESULTS DESCRIPTION OF THE REPORT Attached is the STANFORD achievement Test, Tenth Edition (SAT-10) Content Cluster Analysis report for the March 2005 Administration. The results reported represent a snapshot based on all students at the time tested. The following is a description of each section of the report: A- The top portion of the report contains identifying information such as the school location and name. B- The left-hand section of the report is a listing of the content clusters that are measured within each subtest. For example, under the Reading Comprehension subtest the content clusters reported include literary, informational, and functional. For a more detailed description of the skills measured by each content cluster, please refer to the STANFORD Compendium of Instructional Standards.
2 C- The second column provides the number of items measuring each content cluster. D- The data represents the percent of students scoring in each performance category of above average, average, or below average. E- The upper right portion of the report provides the overall median percentile scores for each subtest and the number of students tested. The median percentile is useful for comparing overall student performance at your school on each subtest relative to the national median, the 50th percentile. F- The information presented within the boxed area explains the data presented for the subtests and content clusters. MIAMI-DADE COUNTY PUBLIC SCHOOLS STANFORD achievement TEST, TENTH EDITION Grade 2 school Level Subtests and Content Cluster Results All Students* school Location: March 2005 Grade 2 SAT-10 Administration school Name: Percent of Students Scoring in Each Category Subtest/ Content Cluster # of Items Below Average Average Above Average Reading Comprehension Literary 14 Informational 13 Functional 08 Mathematics.
3 Problem Solving Number Sense and Operations 24 Patterns and Relationships, and Algebra 04 Geometry and Measurement 10 THE NORMATIVE INFORMATION USED TO PREPARE THIS REPORT IS FROM THE STANFORD achievement Test series , Tenth Edition by Harcourt Assessment, Inc. Copyright @2003 by Harcourt Assessment, Inc. Used with permission of the Publisher Notes: The percent of students scoring in each category was rounded to the nearest whole number. *Based on all students at time tested Subtest Median Percentile # Tested Reading Comprehension Mathematics: Problem Solving The subtest results above show the overall median percentile score in Reading Comprehension and Mathematics: Problem Solving and the number of students tested at your school . The median percentiles are useful for comparing overall student performance at your school on each subtest relative to the national median, the 50th percentile.
4 The SAT-10 Reading Comprehension and Mathematics: Problem Solving subtests are subdivided into smaller content areas called content clusters. For example, the content cluster labeled literacy consists of 14 items within the Reading Comprehension subtest that measure literacy competency. On the left, the SAT-10 content cluster analysis results are reported in terms of the percent of students whose performance, as compared to the national norm, is average, below average, or above average. Based on the norms, the percent of students scoring within each of the three categories is as follows: Below average: 23% Average: 54% Above Average: 23% Assessment and Data Analysis 2005-2006 B AEFDC