Transcription of MICROBIAL DEATH - vency
1 1 MICROBIAL DEATH Antonio Casolari I. A. Microorganisms and Lethal B. Shape of Survivor Curves ..2 II. Single Hit A. Heat Inactivation 1. Thermodynamic a. Maximum Allowable Q10 ..12 b. Minimum Allowable z ..13 c. The Highest Allowable Energy 2. Mechanisms and B. Radiation C. Chemical D. Theoretical III. Target Theory ..18 A. Inactivation by B. Heat Inactivation ..19 C. Limitations of the Theory ..20 IV. Continuously Decreasing DEATH Rate Curves ..20 A. Experimental B. Theoretical C. Mathematical D. Evidence Against Suggested V. Approach to a General Model ..24 A. Heat Inactivation.
2 24 1. Expected Shape of Survivor Curves ..26 2. 3. Inactivation Rate, Temperature, and 30 4. Inactivation Rate and Water Content of the B. Radiation Inactivation ..34 C. Chemical D. Observations ..37 E. Practical Consequences of the VI. Concluding Reproduced from: Bazin, M. J. and Prosser, J. I., Physiological Models in Microbiology,Volume II, CRC Press, Inc., Boca Raton, FL, 1988, pp. 1 - 44. / Modified 2 I. INTRODUCTION MICROBIAL inactivation studies seem to be dominated by the exponential-single hit and multitarget theories, the former being applied mostly to heat inactivation kinetics and the latter to MICROBIAL inactivation by radiations. However, both theories are unable to satisfactorily explain some relevant experimental results, although they are valid enough to be of some predictive value in sterilization technology.
3 Several satellite theories of lesser relevance do not add significantly to the understanding of inactivation phenomena. In this chapter an attempt is made to avoid interpreting experimental data in too simplistic a fashion, and a general theory is presented which provides a unifying description of MICROBIAL inactivation kinetics. A. Microorganisms and Lethal Agents Microorganisms can be regarded as elementary biological particles able to undertake functional relationships within aqueous surroundings, whether provided with levels of autonomous functional organization (bacteria, yeasts, molds, etc.) or not (viruses). Characteristically, the primary function of MICROBIAL interaction with the environment is the production of progeny.
4 Hence, the single practical criterion of DEATH of microorganisms is the failure to reproduce in suitable environmental Physical and chemical agents affecting MICROBIAL activities to such an extent as to deprive MICROBIAL particles of the expected reproductive capacity can be regarded as lethal agents. Heat, ionizing, and UV radiation are the most relevant physical lethal agents. Ultrasonic frequencies, pressure, surface tension, etc. are mostly employed as cell disrupting agents in studying subcellular components. Chemical lethal agents compose a wide range of compounds employed in the MICROBIAL inactivation process called disinfection. The most important are oxygen, hydrogen peroxide, halogens, acids, alkalis, phenol, ethylene oxide, formaldehyde, and glutaraldehyde.
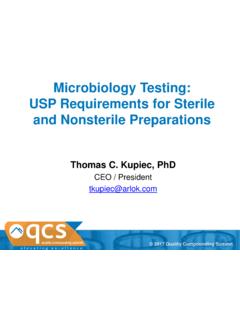
5 B. Shape of Survivor Curves Survivor curves are usually described by plotting the logarithm of the number of microorganisms surviving against the size of treatment (time, dose of radiation, concentration of the chemical lethal agent). Figure 1. Shape of survivor curves of microorganisms treated with lethal agents: convex curve [A], sigmoid [B], concave or continuously decreasing rate curve [C & D]. Cs is the concentration of survivors after the lethal treatment of size S. 0123456789T re a t m e n t s ize , SLo g CsABCD 3 The semilogarithmic plot of survivor curves may have various shapes such as convex, sigmoid, concave, or linear (Figure 1). Different shapes can be obtained: (1) under identical experimental conditions with different microorganisms or with the same organism in a different physiological condition ( , vegetative cell or spore, the former being in the lag or log phase, the latter being activated or dormant, etc.)
6 ; 2) using the same population of organisms while changing the destructive potential of the applied lethal agent (viz., changing the treatment temperature or the concentration of the chemical lethal agent); (3) using the same population of organisms while changing the environment in which the microorganisms are suspended or the culture medium employed to detect surviving fractions, etc. Radiation inactivation studies show the typical convex survivor curve (often erroneously called sigmoid) characterized by a more or less extended lag in inactivation at lower doses (shoulder), followed by a nearly exponential decay phase (Figure 1(A)). Such a shape has also been found in heat inactivation experiments, although less frequently, and in MICROBIAL inactivation by chemical compounds.
7 Often disregarded, though not uncommon, is the true sigmoid shape characterized by a more or less pronounced tail occurring after initial shoulder and exponential decay phases (Figure 1(B)). Concave survivor curves characterized by a continuously decreasing DEATH rate (CDDR) with increasing treatment time or size, and often described as bi- or multiphasic, can be produced by many physical and chemical lethal agents. The complexity of the situation was recognized about 70 years Nevertheless, most of the early authors attempted to describe semilog survivor curves by a straight line (exponential inactivation) regardless of shape, claiming that the direct utilization of the data would have been otherwise quite difficult.
8 The most relevant practical application of the exponential simplification has been in heat sterilization technology. Reports of Bigelow and Esty5 and Esty and Meyer6 on the destruction rate of bacteria subjected to moist heat aided greatly in strengthening the belief in exponential inactivation, although counter to experimental evidence from their own results. Fundamental books on heat sterilization technology7,8 perpetuated the belief in this exponential relationship, particularly the book by Stumbo,8 who tried to explain any deviation from exponential decay with a series of conjectures, rather than with experimental evidence. Meanwhile, Pflug and Schmidt9 claimed that "the majority of survivor curves are not straight lines on semilog plot", but did not propose an acceptable alternative theory.
9 II. SINGLE HIT THEORY According to the single hit theory, the DEATH of microorganisms results from the inactivation of a single molecule or site per cell; the DEATH rate is expected to be proportional to the number of organisms remaining alive and follows first-order kinetics. A. Heat Inactivation Kinetics Plotting logarithm of surviving cell concentration, Nt (Nt /g, Nt /mt, Nt /cm2) against the time, t, of treatment at temperature T, a linear relationship is expected to occur: Log10 Nt = Log10 No - k * t (1) where No is the concentration of the untreated population and k' is the inactivation rate constant. This type of plot is regarded as very convenient if the resistance of different microorganisms is to be compared. In fact, a parameter called the decimal reduction time is easily obtained from the regression coefficient k' and is denoted by D90 , D10 or DT: 4 DT = 1 / k' (2) The use of D90 or D10 refers to the fact that after a treatment time t = 1 / k', 90% of the MICROBIAL population is destroyed or, alternatively, 10% of the population survives.
10 In heat inactivation studies DT is preferred, where T is the treatment temperature. In exponential form, Equation 1 may be written: Nt = No * 10 k * t (3) so that after a treatment time t = t1 Equation 3 becomes: N1= No * 10 k * t1 (4) and after treatment time t = t2: N2 = No * 10 k * t2 (5) Solving for k': N2 / N1 =10 k * (t2 t1) (6) which in logarithmic form yields: Log10 (N2 / N1) = - k' * (t2 - t1) (7) so that: - k' = (Log10 N2 Log10 N1 ) / (t2 - t1) (8) and k' = (Log10 N1 Log10 N2 ) / (t2 - t1) (9) From Equation 2: DT = 1 / k' = (t2 - t1) / (Log10 N1 Log10 N2) (10) and, as expected, if the treatment time is increased from t1 to t2 , 90% of the population is destroyed, (Log10 N1 Log10 N2) equals 1 and the decimal reduction time at temperature T is: DT = t2 - t1 (11) Each type of microorganism (virus, bacterial vegetative cell or spore, yeast vegetative cell or spore, fungal cell or spore), as well as each species and strain of the same group of organisms, has its own resistance at a particular temperature T under defined environmental conditions, that is, its own D.