Transcription of MODAL ANALYSIS - Vrije Universiteit Brussel
1 MODAL ANALYSIS Patrick Guillaume, Department of Mechanical Engineering, Vrije Universiteit Brussel , Pleinlaan 2, B-1050 Brussel , Belgium. Keywords: Vibration, Estimation, Frequency domain, MODAL ANALYSIS , MODAL parameters, Natural frequency, Damping, Mode shapes, Transfer function, SISO, MIMO, Mechanical systems, SDOF, MDOF. Contents 1. Introduction 2. The MODAL Model Single Degree of Freedom Multiple Degree of Freedom Mode Shapes and Operating Deflection Shapes Observability and Controllability of Modes 3. Frequency-Domain Identification of Modes Least-Squares Estimation Common-Denominator Model Linearity in the Parameters Normal Equations Reduced Normal Equations Stabilization Chart Maximum Likelihood Estimation Gauss-Newton Optimization Confidence Intervals 4.
2 Application 5. Conclusion Glossary DOF: Degree of freedom. FRF: Frequency response function. GTLS: Generalized total least squares. IQML: Iterative quadratic maximum likelihood. IRF: Impulse response function. LS: Least squares. LSCE: Least squares complex exponential. MDOF: Multiple-degree-of-freedom. ML: Maximum likelihood. MIMO: Multiple-input-multiple-output SDOF: Single-degree-of-freedom. SISO: Single-input-single-output. TLS: Total least squares. Summary In this contribution the applicability of frequency-domain estimators in the field of MODAL ANALYSIS will be illustrated. The basics of vibration and MODAL ANALYSIS are briefly summarized. In MODAL ANALYSIS , mechanical systems with a few inputs and hundreds of outputs have to be identified.
3 This requires adapted frequency-domain estimators designed to handle large amount of data in a reasonable amount of time. A practical example will be given and finally the conclusions will be drawn. 1. Introduction It is well known that (mechanical) structures can resonate, that small forces can result in important deformation, and possibly, damage can be induced in the structure. Figure 1: Tacoma Narrows Bridge Disaster. The Tacoma Narrows bridge disaster (Figure 1) is a typical example of this. On November 7, 1940, the Tacoma Narrows suspension bridge collapsed due to wind-induced vibration ( flutter). Situated on the Tacoma Narrows in Puget Sound, near the city of Tacoma, Washington, the bridge had only been open for traffic a few months.
4 Wings of airplanes can be subjected to similar flutter phenomena during flight. Before an airplane is released, flight flutter tests have to be performed to detect possible onset of flutter. The classical flight flutter testing approach is to expand the flight envelope of a airplane by performing a vibration test at constant flight conditions, curve-fit the data to estimate the resonance frequencies and damping ratios, and then to plot these frequencies and damping estimates against flight speed or Mach number. The damping values are then extrapolated in order to determine whether it is save to proceed to the next flight test point. Flutter will occur when one of the damping values tends to become negative.
5 Before starting the flight tests, ground vibration tests as well as numerical simulations and wind tunnel tests (see Figure 2) are used to get some prior insight into the problem. (a) (b) Figure 2: Wind tunnel tests on a scaled model of (a) a Cessna and (b) an Airbus A380. The majority of structures can be made to resonate, to vibrate with excessive oscillatory motion. Resonant vibration is mainly caused by an interaction between the inertial and elastic properties of the materials within a structure. Resonance is often the cause of, or at least a contributing factor to many of the vibration and noise related problems that occur in structures and operating machinery. To better understand any structural vibration problem, the resonant frequencies of a structure need to be identified and quantified.
6 Today, MODAL ANALYSIS has become a widespread means of finding the modes of vibration of a machine or structure (Figure 3). In every development of a new or improved mechanical product, structural dynamics testing on product prototypes is used to assess its real dynamic behavior. Figure 3: MODAL ANALYSIS of a car body. 2. The MODAL Model Modes are inherent properties of a structure, and are determined by the material properties (mass, damping, and stiffness), and boundary conditions of the structure. Each mode is defined by a natural ( MODAL or resonant) frequency, MODAL damping, and a mode shape ( the so-called MODAL parameters ). If either the material properties or the boundary conditions of a structure change, its modes will change.
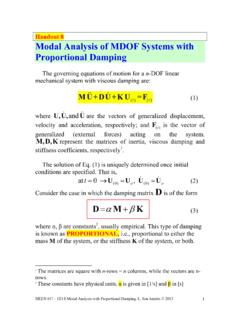
7 For instance, if mass is added to a structure, it will vibrate differently. To understand this, we will make use of the concept of single and multiple-degree-of-freedom systems. Single Degree of Freedom A single-degree-of-freedom (SDOF) system (see Figure 4 where the mass m can only move along the vertical x-axis) is described by the following equation )()()()(tftkxtxctxm=++ (1) with m the mass, c the damping coefficient, and k the stiffness. This equation states that the sum of all forces acting on the mass m should be equal to zero with )(tf an externally applied force, )(txm the inertial force, )(txc the (viscous) damping force, and )(tkx the restoring force. The variable )(tx stands for the position of the mass m with respect to its equilibrium point, the position of the mass when 0)( tf.
8 Transforming (1) to the Laplace domain (assuming zero initial conditions) yields )()()(sFsXsZ= (2) with )(sZ the dynamic stiffness kcsmssZ++=2)( (3) The transfer function )(sH between displacement and force, )()()(sFsHsX=, equals the inverse of the dynamic stiffness kcsmssH++=21)( (4) Figure 4: SDOF system. The roots of the denominator of the transfer function, kcsmssd++=2)(, are the poles of the system. In mechanical structures, the damping coefficient c is usually very small resulting in a complex conjugate pole pair d i = (5) with 2ddf= the damped natural frequency, 2nnf= the (undamped) natural frequency where ==mkn, and ==nmc2 the damping ratio (21 =ndff). If, for instance, a mass m is added to the original mass m of the structure, its natural frequency decreases to )(mmkn +=.
9 If 0=c, the system is not damped and the poles becomes purely imaginary, n i =. The Frequency Response Function (FRF), denoted by )( H, is obtain by replacing the Laplace variable s in (4) by i resulting in cmkkcmHi)(1i1)(22+ =++ = (6) Clearly, if 0=c, then )( H goes to infinity for mkn= (see Figure 4). Although very few practical structures could realistically be modeled by a single-degree-of-freedom (SDOF) system, the properties of such a system are important because those of a more complex multiple-degree-of-freedom (MDOF) system can always be represented as the linear superposition of a number of SDOF characteristics (when the system is linear time-invariant). Multiple Degree of Freedom Multiple-degree-of-freedom (MDOF) systems are described by the following equation )()()()(ttttfKxxCxM=++ (7) In Figure 5, the different matrices are defined for a 2-DOF system with both DOF along the vertical x-axis.
10 X1(t)x2(t)f1(t)f2(t)m2k1c1m1c2k2x1(t)x2( t)f1(t)f2(t)m2k1c1m1c2k2 =2100mmM +=22221kkkkkK +=22221cccccC =)()()(21tftftf =)()()(21txtxtx Figure 5: 2-DOF system. Transforming (7) to the Laplace domain (assuming zero initial conditions) yields )()()sssFXZ(= (8) with )(sZ the dynamic stiffness matrix KCMZ++=sss2)( (9) The transfer function matrix )(sH between displacement and force vectors, )()()(sssFHX=, equals the inverse of the dynamic stiffness matrix )()(][)(12sdssssNKCMH=++= (10) with the numerator polynomial matrix)(sN given by )()(2 KCMadjN++=sss (11) and the common-denominator polynomial )(sd, also known as the characteristic polynomial, )det()(2 KCM++=sssd (12) When the damping is small, the roots of the characteristic polynomial )(sd are complex conjugate pole pairs, m and m , mNm,,1 =, with mN the number of modes of the system.