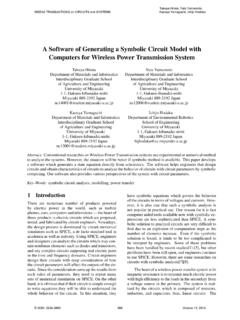
Transcription of MODELING AND SIMULATION OF MOS …
1 MODELING AND SIMULATION OF MOSTRANSISTOR MISMATCHG regor Cijan1, Tadej Tuma2, Arp ad B urmen31 Regional Development Agency of Northern Primorska,5290 Sempeter pri Gorici, Mednarodni prehod 4, Slovenia2,3 University of Ljubljana, Faculty of Electrical Engineering1000 Ljubljana, Tr za ska 25, Cijan)AbstractThe paper is an overview of MOS transistor mismatch MODELING and SIMULATION over the ex-istent literature. The fluctuations of physical parameters and line width are the main causes ofmismatch. There are two types of mismatch . Systematic mismatch can be reduced to greatextent with proper layout. Different patterns are available, that are able to reduce from linearto n-th order polynomial systematic mismatch . Stochastic mismatch can only be reduced withbetter process control and larger transistor areas. There are different approaches for calculatingthe standard deviation representing stochastic mismatch .
2 Simple formulas ( square root ofarea rule) are most commonly used. With the reducing of the transistor area some new effectsshould be considerate and more complex formulas are needed. On the other hand correlationfunctions and frequency domain analysis with spatial spectra give more accurate results. Thesetwo approaches are more general but they do not give physical insight and the final layoutshould be known. mismatch can be simulated in several ways. Brute force SIMULATION basedon Monte-Carlo analysis is appropriate for any kind of distribution but it is the most time ex-pensive. Simulations based on small signal analysis are faster because less circuit simulationsare needed to calculate the sensitivity. Two different approaches to calculate the sensitivity arepresented in this : MOS transistor mismatch , SIMULATION , modelingPresenting Author s BiographyGregor Cijan. Received the uni.
3 Dip. ing. degree in electrical engineeringfrom the University of Ljubljana in 2006. Since 2006 he has been a juniorresearcher with the Regional Development Agency of Northern he is a student at the Faculty of Electrical engineering,University of Ljubljana. His research interests include circuit SIMULATION ,circuit optimization, and MODELING and SIMULATION of device IntroductionThe paper is an overview of MOS transistor mismatchmodeling and SIMULATION . mismatch is an effect thatarises in IC fabrication and is a limiting factor of theaccuracy and reliability of many analog and digital inte-grated circuits. Due to mismatch two equally designed(drawn) transistors display different electrical behaviordue to mismatch . The main reason for the differencesis the non-uniformity of process parameters across thewafer. mismatch affects electrical parameters of thetransistor, which in turn differ between two identicallydrawn devices.
4 Consequently the operating point andother circuit characteristics differ from their desired first studies on MOS technology mismatch weredone in the early 80 s on capacitors [1, 2]. Later studyof mismatch was extended to MOS transistor becausenot all high speed precision circuits can be designedwith matching capacitor technique. The first researchesof MOS transistors matching identified some sourcesof mismatch [3] and defined a model that expressed thestandard deviation of threshold voltage(Vt)and cur-rent factor( )with the physical parameter of the MOStransistor [4]. A general parameter mismatch variancemodel was presented by Pelgrom et al. [5] in 1989. Thissimple model represented the reference for mismatchmodeling in analog integrated circuits for a rest of the paper is organized as follow: In Section2 two types of mismatch effect are presented. Furthersection 3 describe different way of mismatch modelingand in section 4 some common approaches to simulatemismatch are Stochastic and systematic mismatchThe main reason for MOS transistor mismatch is thestochastic nature of the fabrication process.
5 After thedies are produced some additional mismatch is addedduring the die bonding [6]. In general mismatch can bedivided in two components: a local (statistical) and aglobal (stochastic) StochasticThe main reason for the statistical component is thevariation of the fabrication process, caused by randommicroscopic device architecture fluctuations, such asstatistical variations in the number of dopant atoms,built-in electrical charges, gate-oxide thickness, edgeroughness, mismatch can only be reduced with betterprocess control and larger transistor areas. The W/Lratio also influences transistor mismatch . In [7] it wasshown how matching can be improved without chang-ing the layout area. Better matching is obtained if theratio. This, however, reduce the switching speed. Be-cause of this weakness the approach is not SystematicSome possible reasons for the systematic componentare non-uniform thermal distribution during the fabri-cation process, lens aberration during the photolitho-graphic process, etc.
6 The systematic component is de-terministic and also a model is available in [8], but be-cause the placement and the orientation of the transis-tor on the die and within the wafer are unknown in thedesign phase, it is also often modeled as a mismatch can be reduced to great extentwith proper layout. For the best matching of twoequally designed devices they should be as close as pos-sible with their wider side in parallel. In Fig. 1. Thetransistors pair 1 and 3 matches better than 1 and better results can be achieved by dividing a tran-1432 Fig. 1 Systematic mismatch areasistor in smaller devices connected in parallel that arearranged in different patterns [9]. Three different layouttechniques capable of canceling systematic mismatcherror due to higher-order gradient effects are presentedin [10]. These are central symmetry pattern (Fig. 2 a-f), circular symmetry pattern (Fig. 2 g) and hexagonaltessellation (Fig.)
7 2 h). The n-th order central symmetryand n-th order circular symmetry can cancel mismatchfrom linear to the n-th order polynomal between twodevices by using2nunit cells for each one. The hexag-onal tessellation has a higher area-efficiency because itcan cancel quadratic gradient with only 3 units per ModelingRandom variations of physical parameters result in ran-domly distributed MOS transistor model often the Gaussian distribution is used for model-ing the stochastic variations of model parameters. Theamount of mismatch can be expressed with standard de-viations ( ) of transistor model parameters. There aredifferent approaches for calculating this standard devia-tion. Simple formulas ( square root of area rule) are1221122111122221122112211112222111122 2211221122112211221(a)(d)(b)(c)(e)(f)122 11122122112(h)(g)Fig. 2 Pattern to reduce systematic mismatch . 1 and 2denote the smaller devices that constitute transistors 1and commonly used.
8 On the other hand correlationfunctions, and frequency domain analysis with spatialspectra give more general Simple FormulasIn 1986 Lakshmikumar et all. [4] described the MOStransistor mismatch model for the standard deviation ofthe threshold voltage (VT) and current factor ( ), whichwas derivered from the physical sources of 1989 Pelgrom [5] proposed a more general modelbased on mathematical treatment done in the frequencydomain, and not in the spatial domain as Lakshmikumardid. The model takes into account local process varia-tions (characterized by spatial white noise) and globalproces variation (characterized by a single spatial fre-quency inversely proportional to the wafer diameter).The standard deviation of a parameter difference ( P)between two identically drawn transistors is expressedby Eq. (1), 2( P) =A2pW L+S2p D2(1)whereAPandSPare technology-dependent parame-ters, W and L are channel dimensions, and D is the dis-tance between two transistors.
9 Most commonly usedtransistor parameters in mismatch MODELING are thresh-old voltage (VT) and current factor ( ), although somemodels use additional parameters [11]. Short and narrow channelsThe model presented in (1) is a good approximation fortransistor sizes above2 m. For short and narrow chan-nel transistors built mCMOS technology somenew effects must be considered and additional terms ap-pear in Eq. (2) and Eq. (3) [5, 12]. For small geome-try MOS devices the channel depletion tickness can nologer be considered uniform. The depletion charge vari-ance contributes a1W L2term and a1W2 Lterm resultingin a new mismatch model for threshold voltage (2). 2( Vt) =A21 VtW L+A22 VtW L2 A23 VtW2L+S2 VtD2(2)An extendent current factor mismatch model (3) hasbeen presented in [5]. Pelgrom predicted that for shortand narrow channel devices the edge roughness effectbecomes important and appears as additional terms inthe current-factor variance.
10 2( )=A21 W L+A22 W L2+A23 W2L+S2 D2(3)For big devices the two terms(1W2 Land1W L2)in Eq.(2) and (3) can be neglected and model (1) is obtained[5]. The last term in Eq. (2) and (3) is due to gra-dient mismatch . The value of mismatch model (2, 3)parameters ( t,A1 , etc.) can be obtained byprocessing statistical data acquired from the measure-ments of many dies with several transistors (differentW/L values) distributed across a the other hand some physical models are also avail-able in the literature for short channel devices. Two dif-ferent approaches for MODELING the short channel effectand a model that takes into account the quantum effectare presented in [13]. Frequency domain analysis with spatial spec-traA more general approach is frequency domain model-ing with spatial spectra [14]. The value of a transistorparameter is obtained by integrating a noise functionp(x, y)representing parameters variation over the de-vice area.