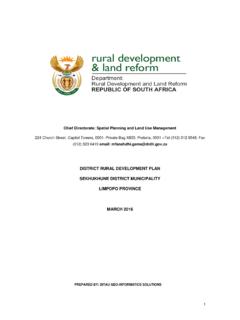
Transcription of Mogale City Local Municipality LED Strategy
1 Mogale City Local Municipality LED Strategy 38 The promotion of sustainable rural development ; The development and improvement of linkages with Johannesburg, Tshwane, Madibeng, the rest of Gauteng and the broader region, and Service delivery, specifically focusing on providing sufficient capacity in development priority areas. City LM IDP, 2011 Service Delivery and Infrastructure development . o The major priority is housing and rural development Economic growth and development o The major priority is Local economic development , special emphasis is place on Local procurement of goods and services Social development o The major priority is on poverty alleviation Democracy and Good Governance o The engagement of communities through various mechanisms including Mayoral roadshows, enhancement of the role of ward committees and the five identified sectors viz. Business, labour, youth, religious grouping and safety Section 3 Situational Analysis Introduction The demographic features of the Mogale City Local Municipality are investigated in this section.
2 The purpose of the section is to provide an overview of the socio-economic characteristics of the Municipality . Such an overview will assist in identifying the localised issues with reference to demographic and labour force dimensions. In order to provide comprehensive baseline information regarding the mentioned dimensions, the characteristics of the following salient features are investigated: Demarcation of the Study Area Mogale City Local Municipality LED Strategy 39 Demographic features (population size, population growth, and gender and age distribution) Demographic indicators (education, employment, income) Access to services Demarcation of the Study Area Mogale City is situated at the Western side of the Gauteng Province. It also forms part of thebroader West Rand District Municipality , which consist of four Local municipalities Randfontein,Westonaria, Mogale City and Merafong City.
3 Mogale City is made up of the following areas (See Map 1 below): Kagiso & Rietvallei 1,2 & 3 Azaadville Krugersdorp and surrounding areas Munsieville Muldersdrift Tarlton Sterkfontein Magaliesburg Hekpoort Mogale City Local Municipality LED Strategy 40 Map 1: Mogale City Locational Map Demographic Features According to theCommunity Survey 2007 from Statistics South Africa, the total population of Mogale City is 319,614persons, which shows an increase of 29,927 persons from 289,714 persons count of the Census2001. Assuming a historic growth rate of per annum the estimated population for 2010 is approximately 332,663 people. Table illustrates the population and household figures for Mogale City Local Municipality . Table : Population and Household Figures 2001 2007 Growth Rate (%) 2010 (est) Population 289,714 319,614 332,663 Households 89,475 93,183 93,586 Source: Statistics South Africa, 2007 and Quantec Resource Database, 2010 Figure : Population Demography, 2007 Mogale City Local Municipality LED Strategy 41 Source: Statistics South Africa Community Survey, 2007 In terms of population demography, the black population makes up 69% of the population while the white population is around 25%.
4 Employment Status The unemployment rate for both the West Rand and Mogale City is below the national unemployment rate of Mogale City has an unemployment rate of 22%, which is low for an urban area. Table : Employment Status, 2009 Employed Unemployed Not Economic Active Unemployment Rate Labour Participation Rate West Rand DM 153,619 58,999 165,168 25% 59% Mogale City LM 95,035 31,610 87,075 22% 62% Source: Labour Force Survey, Statistics South Africa, 2010 Household Income Mogale City Local Municipality LED Strategy 42 The annual household income levels are illustrated in Figure Approximately of households in Mogale City Local Municipality earn no income while the majority ( ), of households earn between R9,600 and R76,000 a year. Figure : Annual Household Income, 2007 Source: Statistics South Africa Community Survey, 2007 Education Only around of the population does not have any schooling while 22% of Mogale City s population have completed high school (See Figure ).
5 One area which can improve is tertiary education with only of the population that has a tertiary degree. Improved education will mean improved skills in the workplace and less unemployment. It is imperative that the number of tertiary graduates be increased over the coming years. Figure : Population Education Levels, 2007 Mogale City Local Municipality LED Strategy 43 Source: Statistics South Africa Community Survey, 2007 Access to Services It is imperative that the population of Mogale City have access to basic services. The Municipality has over the years increased service delivery in an attempt to eradicate the service delivery backlogs. This section will examine the status of service delivery in terms of the access to services. Access to Water It is a government target that there should be universal access to water by 2012. It is Mogale City spriority that all residents should access to piped water.
6 Currently only of thehouseholds are not connected to the Mogale City Water pipelines, % uses boreholewater and use river water. A majority of the residents have access to piped water. Figure shows that of households have access to pipe water inside the dwelling compared to in 2001. About 45% of households have access to pipe water in the yard ( Mogale City IDP, 2010/11). Figure : Access to Piped Water Mogale City Local Municipality LED Strategy 44 Source: Statistics South Africa Community Survey, 2007 Access to Sanitation Universal target to access to sanitation has the same 2012 target as that of access to piped to Community Survey, sanitation levels in Mogale City are of high quality. Mogale Citynever had bucket toilet areas that are serviced by the Municipality . Table : Access to Sanitation Facilities 2001 2007 Flush Toilet (sewerage) Flush Toilet (septic tank) Dry Toilet Pit latrine with ventilation Pit latrine without ventilation Chemical Toilet Bucket Latrine None Source: Mogale City IDP, 2010/11 Thehouseholds with pit latrine without ventilation toilets and households without any toilet facilitiesmake up 7% and % of the total households.
7 These households are largely concentrated in therural farms, which are private farmland areas of Mogale City ( Mogale City IDP, 2010/11). Mogale City Local Municipality LED Strategy 45 Access to Refuse Removal Figure illustrates that over 80% of the households get their refuse removed once a week by themunicipality in 2007. In 2001 about 74 % households were rendered refuse removal. Figure : Access to Refuse Removal Source: Mogale City IDP, 2010/11 Access to Electricity Currently, there is no electricity backlog in households. Eskom is the distributer and service providerof electricity in the larger part of Mogale City, such as Kagisoa and Rietvallei. The City only servicesurban suburbs such as Azaadville, Noordhewel, Munsieville, CBD and the surrounding areas ( Mogale City IDP, 2010/11). Road Infrastructure The road infrastructure in the Mogale City is relative good standard, with almost all streets larger settlements such as Munsieville and Kagiso townships have tarred roads with storm watersystem.
8 Mogale City, under its jurisdiction area, has about 1,200 total kilometres (km) of roads, which1,000km is tarred or paved and approximately 200km of roads is unpaved. This figure excludes ruralroads. The area of informal settlements such as Soul City, Pango, Tuder shaft and Orient Hills stillremain not tarred pending their formalisation ( Mogale City IDP, 2010/11). Mogale City Local Municipality LED Strategy 46 Housing Developments Housing delivery to the poor is one of the important service delivery areas that government ispursuing. The provision of low-income, subsidy housing, popular known as RDP houses have beenvehicle for housing delivery. According to the 2007 Community Survey, housing delivery has increased by from in 2001 to in 2007. Figure : Types of Dwellings ( Mogale City IDP, 2010/11) Figure illustrates that informal dwellings have decrease from 29% in 2001 to in 2007.
9 Government target is to eradicate all informal settlements by 2014. Summary of Infrastructure Backlogs and Services The infrastructure backlog in terms of Municipal Infrastructure Grant (MIG) refers to the householdsthat do not have access to basic infrastructure services such as water, sanitation, electricity and roads on or before 1994. Mogale City Local Municipality LED Strategy 47 Table : Mogale City MIG Backlogs Service Census 2001 Backlogs addressed up to 2007/2008 Current Backlogs Backlogs planned to be addressed Backlogs end of 2008/2009 Water 5,138 638 4,500 1,957 2,543 Sanitation 15,558 1050 14,508 1,000 13,508 Road and Storm water 1,144 86 1,058 54 1,058 Street Lighting 5,945 0 5,945 5,945 5,945 Source: Mogale City Project Management Unit (MIG) Section 4 Economic Analysis Introduction The purpose of this section is to provide an updated Economic Profile using the latest economic data available, and additional economic techniques were utilised in order to add value to the previous profile.
10