Transcription of MoLE Gas Laws Activities - Intro.chem.okstate.edu
1 1 MoLE Gas laws Activities *To begin this assignment you must be able to log on to the Internet using InternetExplorer (Microsoft) or higher. If you do not have the current version of the browser, go and follow the instructions on the page. You will needInternet Explorer for your particular operating system. If you have any difficulties contact the browser is running, type the following address into the location-input line nearthe top of the Internet Explorer window: will load the Gas Simulation. Once you have the simulation is running your screen willlook like what is shown in left hand section of Figure I.
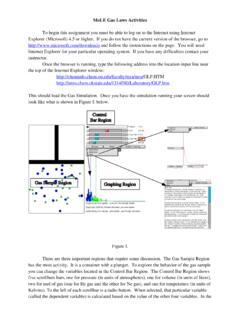
2 Are three important regions that require some discussion. The Gas Sample Regionhas the most activity. It is a container with a plunger. To explore the behavior of the gas sample * Michael R. Abraham & John Gelder, September 2002 Control Bar RegionGas Sample RegionGraphing Region2you can change the variables located in the Control Bar Region. The Control Bar Region showsfive scrollbars: pressure (in units of atmospheres), volume (in units of liters), mol of gas (one forHe gas and the other for Ne gas), and temperature (in units of Kelvins).
3 To the left of eachscrollbar is a radio button. When selected, that particular variable (called the dependent variable)is calculated based on the value of the other four variables. In the default mode the pressurescrollbar's radio button is selected so the pressure of the gas sample is a simple exploration try moving each of the scrollbars and observe the effect on thegas sample. These effects will be addressed in more detail in this are three buttons immediately below the Control Bar Region. The Pause buttonwill suspend the motion in the gas sample, the Reset button returns the program to the defaultconditions, and the Enable Tracking button turns a red tracking line on and the Pause Button is a fourth button different from the previous three in that it is adropdown menu.
4 Clicking and holding the mouse button will reveal three choices: Velocities(default); Relations (graphing); and default mode is Velocities. The Velocity Distribution Region shows a plot of thevelocity distribution in the gas sample (see Figure II.). The y-axis of this plot represents thenumber of particles. The x-axis represents the range of velocities starting at zero. The bars in thisplot represent the velocities of the particles in the Gas Sample Region. As the velocities of theparticles change, the plot is redrawn.
5 The smooth curved line in the plot represents the idealdistribution of the velocities for the gas sample. The vertical line represents the average (root-mean-square average) velocity of the sample. Observe the behavior of this region while changingeach of the variables in the Control Bar Region. In the Gas Sample Region, one of the particles islabeled with a red dot. this same particle is identified in red in the velocity distribution plot. Ifyou click on the enable tracking button, you can follow the path of the particle.
6 The length of thetail represents a fixed unit of time, and consequently can be used as a measure of the velocity ofthe particle. If you pause the motion of the particles, you can click on different particles to get ameasure of their second choice from the drop down menu is the Relations view. this choice reveals anx,y graph with a dropdown menu on each axis. Selecting the dropdown menu on either axis3provides a list of the variables shown in the Control Bar Region. The two buttons, Enable andMultiple are used when plotting pairs of variables.
7 If you select pressure for the y-axis andvolume for the x-axis, and the click on Enable, these same variables are activated in theControl Bar Region. By scrolling the volume slide bar in the Control Bar Region you will traceout a plot that will look similar to Figure Multiple Button allows two or more plots to be superimposed. Select Pressure and Volumeas the variable to be plotted on your graph. Then click on the Multiple button and adjust thetemperature to 400 K. Click on the Enable button and scroll the Volume slide bar.
8 Click on theDisable button and change the temperature to 200 K. Click on the Enable button and scroll theVolume slide bar. Repeat this process for the minimum temperature. You will see a graph thatlooks similar to Figure the hang of it? If you have any questions check with another student in the class,your Pressure and Volume RelationshipsExp. Computer Simulation -A*Name_____Lab Section_____Problem Statement: How are the pressure and volume of a gas sample related? the Gas Law Simulation program and observe and describe, in the space below, theactivity in the Gas Sample window.
9 Consider using the some or all of the following terms inyour description: particles, atoms, molecules, collisions, velocity, energy, of the objects in the window is colored differently than the others. Enable the trackingfunction and trace the path of a particle from one side of the screen to the other in the spacebelow. Explain any changes in velocity or direction that you observe. * Michael R. Abraham & John Gelder, September 20025C. Record the values for pressure, volume and temperature on the digital read-outs of theControl Bar Observe the action in the Velocity Distribution window.
10 Relate what you see with thebehavior of the objects in the Gas Sample the Pause button and sketch and label the graph in the space the controls in the Control Bar window, fix Pressure as a dependent variable byclicking on its radio button. Change the volume of the container using the Volume slider barand observe what happens to the pressure of the system. Also observe what happens in theVelocity Distribution window. Explain how the activity in the Gas Sample window accountsfor your five additional observations of volume/pressure relationships and record all of yourdata in the following TablePressure Analysis:What patterns are shown in these data?