Transcription of MULTI-SCALE STRUCTURAL SIMILARITY FOR IMAGE QUALITY ...
1 Published in: Proceedings of the 37th IEEE Asilomar Conference on Signals, Systems and Computers, Pacific Grove, CA, Nov. 9-12, 2003. IEEE. MULTI-SCALE STRUCTURAL SIMILARITY FOR IMAGE QUALITY ASSESSMENT. Zhou Wang1 , Eero P. Simoncelli1 and Alan C. Bovik2. (Invited Paper). 1. Center for Neural Sci. and Courant Inst. of Math. Sci., New York Univ., New York, NY 10003. 2. Dept. of Electrical and Computer Engineering, Univ. of Texas at Austin, Austin, TX 78712. Email: ABSTRACT stimuli. Thus, these approaches must rely on a number of strong assumptions and generalizations [4],[5]. Furthermore, as the num- The STRUCTURAL SIMILARITY IMAGE QUALITY paradigm is based on the ber of HVS features has increased, the resulting QUALITY assessment assumption that the human visual system is highly adapted for systems have become too complicated to work with in real-world extracting STRUCTURAL information from the scene, and therefore a applications, especially for algorithm optimization purposes.
2 Measure of STRUCTURAL SIMILARITY can provide a good approxima- STRUCTURAL SIMILARITY provides an alternative and complemen- tion to perceived IMAGE QUALITY . This paper proposes a MULTI-SCALE tary approach to the problem of IMAGE QUALITY assessment [3] . STRUCTURAL SIMILARITY method, which supplies more flexibility than [6]. It is based on a top-down assumption that the HVS is highly previous single-scale methods in incorporating the variations of adapted for extracting STRUCTURAL information from the scene, and viewing conditions. We develop an IMAGE synthesis method to therefore a measure of STRUCTURAL SIMILARITY should be a good ap- calibrate the parameters that define the relative importance of dif- proximation of perceived IMAGE QUALITY . It has been shown that ferent scales. Experimental comparisons demonstrate the effec- a simple implementation of this methodology, namely the struc- tiveness of the proposed method. tural SIMILARITY (SSIM) index [5], can outperform state-of-the-art perceptual IMAGE QUALITY metrics.
3 However, the SSIM index al- 1. INTRODUCTION gorithm introduced in [5] is a single-scale approach. We consider this a drawback of the method because the right scale depends on Objective IMAGE QUALITY assessment research aims to design qual- viewing conditions ( , display resolution and viewing distance). ity measures that can automatically predict perceived IMAGE qual- In this paper, we propose a MULTI-SCALE STRUCTURAL SIMILARITY method ity. These QUALITY measures play important roles in a broad range and introduce a novel IMAGE synthesis-based approach to calibrate of applications such as IMAGE acquisition, compression, commu- the parameters that weight the relative importance between differ- nication, restoration, enhancement, analysis, display, printing and ent scales. watermarking. The most widely used full-reference IMAGE QUALITY and distortion assessment algorithms are peak signal-to-noise ra- tio (PSNR) and mean squared error (MSE), which do not correlate 2.
4 SINGLE-SCALE STRUCTURAL SIMILARITY . well with perceived QUALITY ( , [1] [6]). Traditional perceptual IMAGE QUALITY assessment methods are Let x = {xi |i = 1, 2, , N } and y = {yi |i = 1, 2, , N } be based on a bottom-up approach which attempts to simulate the two discrete non-negative signals that have been aligned with each functionality of the relevant early human visual system (HVS) other ( , two IMAGE patches extracted from the same spatial lo- components. These methods usually involve 1) a preprocessing cation from two images being compared, respectively), and let x , process that may include IMAGE alignment, point-wise nonlinear x2 and xy be the mean of x, the variance of x, and the covariance transform, low-pass filtering that simulates eye optics, and color of x and y, respectively. Approximately, x and x can be viewed space transformation, 2) a channel decomposition process that trans- as estimates of the luminance and contrast of x, and xy measures forms the IMAGE signals into different spatial frequency as well as the the tendency of x and y to vary together, thus an indication of orientation selective subbands, 3) an error normalization process STRUCTURAL SIMILARITY .
5 In [5], the luminance, contrast and structure that weights the error signal in each subband by incorporating the comparison measures were given as follows: variation of visual sensitivity in different subbands, and the vari- 2 x y + C 1. ation of visual error sensitivity caused by intra- or inter-channel l(x, y) = , (1). neighboring transform coefficients, and 4) an error pooling pro- 2x + y2 + C1. cess that combines the error signals in different subbands into a 2 x y + C 2. c(x, y) = 2 , (2). single QUALITY /distortion value. While these bottom-up approaches x + y2 + C2. can conveniently make use of many known psychophysical fea- xy + C3. tures of the HVS, it is important to recognize their limitations. In s(x, y) = , (3). x y + C 3. particular, the HVS is a complex and highly non-linear system and the complexity of natural images is also very significant, but most where C1 , C2 and C3 are small constants given by models of early vision are based on linear or quasi-linear oper- ators that have been characterized using restricted and simplistic C1 = (K1 L)2 , C2 = (K2 L)2 and C3 = C2 /2, (4).
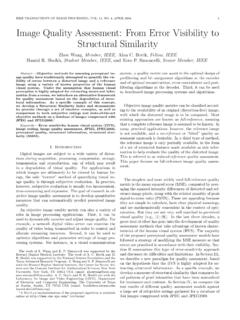
6 Signal 1 L 2 L 2 .. L 2. c1(x, y) c2(x, y) .. cM(x, y) SIMILARITY lM(x, y). s1(x, y) s2(x, y) sM(x, y) measure signal 2 L 2 L 2 .. L 2. Fig. 1. MULTI-SCALE STRUCTURAL SIMILARITY measurement system. L: low-pass filtering; 2 : downsampling by 2. respectively. L is the dynamic range of the pixel values (L = 255 MULTI-SCALE method is a convenient way to incorporate IMAGE de- for 8 bits/pixel gray scale images), and K1 1 and K2 1 are tails at different resolutions. two scalar constants. The general form of the STRUCTURAL SIMILARITY We propose a MULTI-SCALE SSIM method for IMAGE QUALITY as- (SSIM) index between signal x and y is defined as: sessment whose system diagram is illustrated in Fig. 1. Taking the reference and distorted IMAGE signals as the input, the system SSIM(x, y) = [l(x, y)] [c(x, y)] [s(x, y)] , (5) iteratively applies a low-pass filter and downsamples the filtered IMAGE by a factor of 2. We index the original IMAGE as Scale 1, where , and are parameters to define the relative importance and the highest scale as Scale M , which is obtained after M 1.
7 Of the three components. Specifically, we set = = = 1, and iterations. At the j-th scale, the contrast comparison (2) and the the resulting SSIM index is given by structure comparison (3) are calculated and denoted as cj (x, y). (2 x y + C1 ) (2 xy + C2 ) and sj (x, y), respectively. The luminance comparison (1) is com- SSIM(x, y) = , (6) puted only at Scale M and is denoted as lM (x, y). The overall ( 2x + 2y + C1 ) ( x2 + y2 + C2 ). SSIM evaluation is obtained by combining the measurement at dif- which satisfies the following conditions: ferent scales using 1. symmetry: SSIM(x, y) = SSIM(y, x);. Y. M. 2. boundedness: SSIM(x, y) 1; SSIM(x, y) = [lM (x, y)] M [cj (x, y)] j [sj (x, y)] j . (7). j=1. 3. unique maximum: SSIM(x, y) = 1 if and only if x = y. The universal IMAGE QUALITY index proposed in [3] corresponds Similar to (5), the exponents M , j and j are used to ad- to the case of C1 = C2 = 0, therefore is a special case of (6).
8 The just the relative importance of different components. This multi- drawback of such a parameter setting is that when the denominator scale SSIM index definition satisfies the three conditions given in of Eq. (6) is close to 0, the resulting measurement becomes unsta- the last section. It also includes the single-scale method as a spe- ble. This problem has been solved successfully in [5] by adding cial case. In particular, a single-scale implementation for Scale M. the two small constants C1 and C2 (calculated by setting K1 = applies the iterative filtering and downsampling procedure up to and K2 = , respectively, in Eq. (4)). Scale M and only the exponents M , M and M are given non- We apply the SSIM indexing algorithm for IMAGE QUALITY as- zero values. To simplify parameter selection, we let j = j = j for sessment using a sliding window approach. The window moves all j's. In addition, we normalize the cross-scale settings such that pixel-by-pixel across the whole IMAGE space.
9 At each step, the PM. j=1 j =1. This makes different parameter settings (including SSIM index is calculated within the local window. If one of the all single-scale and MULTI-SCALE settings) comparable. The remain- IMAGE being compared is considered to have perfect QUALITY , then ing job is to determine the relative values across different scales. the resulting SSIM index map can be viewed as the QUALITY map Conceptually, this should be related to the contrast sensitivity func- of the other (distorted) IMAGE . Instead of using an 8 8 square tion (CSF) of the HVS [7], which states that the human visual sen- window as in [3], a smooth windowing approach is used for local sitivity peaks at middle frequencies (around 4 cycles per degree statistics to avoid blocking artifacts in the QUALITY map [5]. Fi- of visual angle) and decreases along both high- and low-frequency nally, a mean SSIM index of the QUALITY map is used to evaluate directions.
10 However, CSF cannot be directly used to derive the the overall IMAGE QUALITY . parameters in our system because it is typically measured at the visibility threshold level using simplified stimuli (sinusoids), but 3. MULTI-SCALE STRUCTURAL SIMILARITY our purpose is to compare the QUALITY of complex structured im- ages at visible distortion levels. MULTI-SCALE SSIM index The perceivability of IMAGE details depends the sampling density Cross-scale calibration of the IMAGE signal, the distance from the IMAGE plane to the ob- server, and the perceptual capability of the observer's visual sys- We use an IMAGE synthesis approach to calibrate the relative impor- tem. In practice, the subjective evaluation of a given IMAGE varies tance of different scales. In previous work, the idea of synthesizing when these factors vary. A single-scale method as described in images for subjective testing has been employed by the synthesis- the previous section may be appropriate only for specific settings.