Transcription of Multiple Imputation Using the Fully Conditional ... - SAS
1 Paper 2081-2015. Multiple Imputation Using the Fully Conditional Specification Method: A Comparison of SAS , Stata, IVEware, and R. Patricia A. Berglund, University of Michigan-Institute for Social Research ABSTRACT. This presentation emphasizes use of SAS to perform Multiple Imputation of missing data Using the PROC MI Fully Conditional Specification (FCS) method with subsequent analysis Using PROC. SURVEYLOGISTIC and PROC MIANALYZE. The data set used is based on a complex sample design. Therefore, the examples correctly incorporate the complex sample features and weights. The demonstration is then repeated in Stata, IVEware, and R for a comparison of major software applications that are capable of Multiple Imputation Using FCS or equivalent methods and subsequent analysis of imputed data sets based on a complex sample design. INTRODUCTION. Paper 2081-2015 presents a detailed example of Multiple Imputation of missing data from a complex sample design with the Fully Conditional Specification (FCS) method of PROC MI with subsequent analysis Using PROC SURVEYLOGISTIC and PROC MIANALYZE.
2 The application is then repeated Using Stata, IVEware, and R with an equivalent Imputation method while also accounting for the complex sample design features. The application replications enable a direct comparison of results from each software tool. Analysts will gain knowledge and practical guidance for correctly implementing the three step Multiple Imputation process Using data derived from a complex sample design data set. A general overview of the Multiple Imputation process is included but it is assumed that the analyst has a basic understanding of the MI process and analysis of complex sample design data. Multiple Imputation OF MISSING DATA. Multiple Imputation is a robust and flexible option for handling missing data. MI is implemented following a framework for estimation and inference based upon a three step process: 1) formulation of the Imputation model and Imputation of missing data Using PROC MI with a selected method, 2) analysis of complete data sets Using standard SAS procedures (that assume the data are identically and independently distributed or from a simple random sample) or SURVEY procedures for analysis of data from a complex sample design, and 3) analysis of the output from the two previous steps Using PROC.
3 MIANALYZE (Berglund and Heeringa, 2014). A key assumption made in the MI and MIANALYZE. procedures is that the missing data are missing at random (MAR) or in other words, the probability that an observation is missing depends on observed Y but not missing Y, (Rubin, 1987). The featured application implements the PROC MI FCS method for Imputation of missing data in Step 1, use of PROC SURVEYLOGISTIC to perform design-based logistic regression in Step 2, and PROC. MIANALYZE to combine results from previous steps in Step 3. THE Fully Conditional SPECIFICATION (FCS) METHOD. The Fully Conditional Specification (FCS) method is widely used for Imputation of missing data for large mixed sets of continuous, nominal, ordinal, count and semi-continuous variables. The FCS method is also labeled the sequential regression algorithm (Raghunathan, et al. , 2001) in IVEware or the chained equations approach (van Buuren et al.)
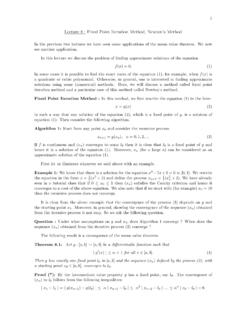
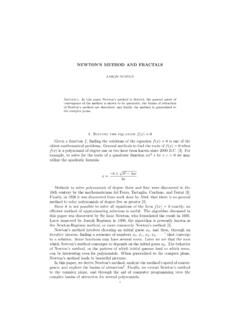
4 , 1999; Royston, 2005; Carlin, et al., 2008) in Stata and R. Broadly described, each of these algorithms is based on an iterative algorithm. Each iteration (t=1, ,T). of the algorithm moves one-by-one through the sequence of variables in the Imputation model, Y={Y1,Y2,Y3,Y4,Y5} as illustrated in Figure 1. 1. Figure 1. Arbitrary Multivariate Missing Data Pattern At each iteration and for each variable, there is a P-Step and I-Step. In the P-Step, the current ( iteration t) values of the observed and imputed values for the Imputation model variables are used to derive the predictive distribution of the missing values for the target variable. To model the Conditional predictive distribution of individual Yk, PROC MI uses the same regression or discriminant function methods available in PROC MI as for the monotone missing data patterns, (Berglund and Heeringa, 2014). See Figure 2 (from the SAS/STAT PROC MI documentation) for a summary of all available Imputation methods in SAS and guidance on selection of an appropriate method.
5 Figure 2. Table : Imputation methods in PROC MI. Multiple Imputation OF COMPLEX SAMPLE DESIGN DATA. Complex surveys are comprised of data derived from sample designs that adjust for non-response and differing probabilities of selection. Complex samples differ from standard or simple random samples in that they assume independence of observations while complex samples do not. Most SAS procedures assume that data used is derived from a simple random sample and under-estimate variances when analyzing data from complex samples. Therefore, analysis of data from complex surveys should include methods of variance estimation that account for these sample design features (Kish, 1965 and Rust, 1985). The SURVEY suite of procedures (PROC SURVEYSELECT, PROC SURVEYMEANS, PROC. SURVEYFREQ, PROC SURVEYREG, PROC SURVEYLOGISTIC, and PROC SURVEYPHREG) allow the analyst to create samples and correctly analyze complex sample design data sets.
6 However, another important consideration is how to correctly incorporate the complex sample design features and weights into the MI framework. Donald Rubin offered the following guidance on MI for complex samples: Minimally, major clustering and stratification indicators and sample design weights (or estimated propensity scores of being in the sample) should be included in the Imputation models. The possible lost 2. precision when including unimportant predictors is usually a small price to pay for the general validity of the resultant multiply imputed data base , (Rubin, 1996) . To capture the complex sample design features and weight(s) in the Imputation model, a recommended method is to create a categorical variable in the DATA STEP that is the combination of the stratum and cluster codes provided by the data producer. Then, use the combined strata and cluster variable along with the probability weight in the Imputation model during MI Step 1.
7 In Step 2, utilize the correct SAS. SURVEY procedure with weights and design variables, single STRATA, CLUSTER, and WEIGHT. variables to correctly analyze the imputed data sets and finally, use PROC MIANALYZE in MI Step 3 to combine results and produce valid inferences. ANALYSIS APPLICATION. The analysis application is a detailed example that uses PROC MI with the FCS method to impute missing data on categorical variables with an arbitrary missing data pattern, analysis of imputed data sets Using PROC SURVEYLOGISTIC, and analysis of results from MI Steps 1 and 2 Using PROC. MIANALYZE. Because SAS is of primary interest, a detailed discussion of code, output and interpretation is included in this section. The application is then repeated Using Stata, IVEware and R for direct comparison of results. For the replications, the focus is on the final pooled estimates rather than detailed explanations of the full syntax used.
8 For more information on Stata, IVEware, or R, see their respective user manuals. APPLICATION DATA SET. Data from the National Comorbidity Survey-Replication, a nationally representative sample based on a stratified, multi-stage area probability sample of the United States population (Kessler et al, 2004 and Heeringa, 1996) is used in the application. The NCS-R data set is based upon a complex sample design and contains variables representing the design features along with weights that adjust for non-response, differing probabilities of selection and post-stratification to a given population. See the project website at for more information. VARIABLE LIST. The NCS-R data set is from the Part 2 of the survey (n=5,692) and includes a number of detailed questions about DSM-IV disorders and related issues such as treatment and impairment. Variables used are in this application are as follows with variables with missing data highlighted in red: Sex (categorical, coded 0=FEMALE 1=MALE).
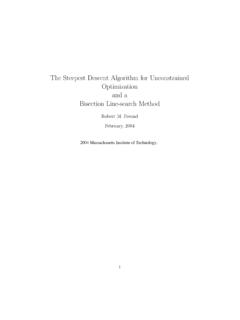
9 Region (categorical, coded 1=NE 2=MW 3=SOUTH 4=WEST). Age (continuous, age in years). Str (continuous, strata representing complex sample design). Secu (categorical, cluster/PSU representing complex sample design). Finalp2wt (continuous, final part 2 weight). Racecat_ (categorical, coded 1=WHITE 2=HISPANIC 3=BLACK 4=OTHER). Educat (categorical, coded 1=0-11 YRS 2=12 YRS 3=13-15 YRS 4=16+ YRS, some missing data). MDE (categorical, coded 1=YES major depressive episode 0=NO MDE, some missing data). Str_Secu (categorical, combined Str and Secu variable). EXAMINATION OF MISSING DATA. Prior to Multiple Imputation of missing data, an important preliminary step is to examine the data set for types of variables (continuous, categorical, count, etc.) that have missing data and the extent and pattern of missing data. Patterns of missing data can be broadly categorized as arbitrary, monotone, or matrix/file-matching, (see Figures 3-5 for graphic representations).
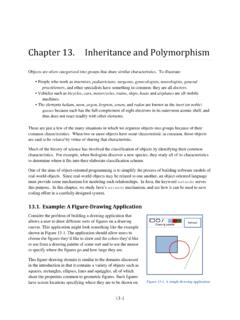
10 Typically, identification of the missing data pattern helps drive the choice of Imputation method and number of imputed data sets created during 3. MI Step 1. For more on the question of how many imputed data sets to create, see Table of the PROC MI documentation. Figure 3. Arbitrary Missing Data Figure 4. Monotone Missing Data Figure 5. File-Matching or Matrix Missing Data APPLICATION Using SAS MI STEP 0 - EXPLORE MISSING DATA. The initial step, here called MI Step 0, explores the characteristics of missing data through use of PROC. MI without Imputation (NIMPUTE=0). PROC MI produces a Missing Data Pattern grid by default. The SAS code below reads in a temporary data set called NCSR2_1 and creates output in Figure 6 below: proc mi nimpute=0 data=ncsr2_1;. run;. 4. Figure 6. Missing Data Patterns, NCS-R Data Set Based on Figure 6, the Model Information table contains basic information about the default Imputation method used had there been an Imputation (MCMC) along with other information related to the Imputation process.