Transcription of Multiple Regression Using SPSS - Miami
1 Multiple Regression Using SPSSP resented by Nasser Hasan -Statistical Supporting Brief introduction of Multiple Linear specificationoAssumptions Multiple Linear Regression Analysis Using spss . Variable Regression Using SPSSO verviewSimple Linear RegressionA simple linear Regression is carried out to estimate the relationship between a dependent variable, Y, and a single predictor variable, Regression Using SPSSO verviewMultiple Linear RegressionA Multiple linear Regression analysis is carried out to predict the values of a dependent variable, Y, given a set of kthpredictor variables (X1, X2.)
2 , Xk). We also use it when we want to determine which variables are better predictors than others. (Variables Selection)YXkX2X1 ErrorMultiple Regression Using SPSSO verviewAssumptionsMultiple Regression Using SPSSO verviewAssumptionsMultiple Regression Using SPSSO verviewAssumptions5) Linearity: relationship between DV and IVs should be ) No perfect Regression Using SPSSP erforming the Analysis With SPSSD ataset:-This data contains four variables from 20 students that are related to students performance on variables:oExam score (ratio)oHours spent revising (ratio)oAnxiety score (ratio)oA-level entry points (ratio)Please download the dataset Using this link: thanks to Ian Walker University of BathMultiple Regression Using SPSSP erforming the Analysis With SPSSE xample 1:-We want to determine whether hours spent revising, anxiety scores, and A-level entry points have effect on exam scores for variable: exam scorePredictors.
3 Hours spent revising, anxiety scores, and A-level entry Regression Using SPSSP erforming the Analysis With SPSSR egression ModelExam scoreAnxiety scoreHours spent revisingA-level entry pointsErrorMultiple Regression Using SPSSP erforming the Analysis With SPSSA nalyze > Regression > Linear > Move score to Dependent, all other variables to Independent(s) Multiple Regression Using SPSSP erforming the Analysis With SPSSC lick on Statistics > Check on the following options > ContinueMultiple Regression Using SPSSP erforming the Analysis With SPSSC lick on Plots > Check Histogram and Normal probability plot under Standardized Residual Plots > move *ZRESID to Y and move *ZPRED to X > Continue Multiple Regression Using SPSSSPSS OutputMultiple Regression Using SPSSSPSS OutputMultiple Regression Using SPSSSPSS OutputMultiple Regression Using SPSSSPSS Output Model SummeryR.
4 Multiple correlation coefficient= . : coefficient of determination= . model explains of the variation in the dependent (to assess autocorrelation) Residuals are negatively correlatedMultiple Regression Using SPSSSPSS Output ANOVA tableThe overall model is significantly useful in explaining exam score, (3, 16) = , < . Regression Using SPSSSPSS Output Collinearity AssumptionA value larger than 10 indicates collinearity between Regression Using SPSSSPSS Output The Significance of the Effect Hours has significant effect on exam score, (16)= , <.
5 05. Anxiety does not have a significant effect on exam score, (16)= , = .09. A-level has significant effect on exam score, (16)= , < . Regression Using SPSSSPSS Output Interpreting CoefficiantsExam score = + (.55*hours) + (.10*anxiety) + ( *A-level) With one-unit increase in hours, the exam score increases by .55. With one-unit increase in anxiety, the exam score increases by .10. With one-unit increase in A-level, the exam score increases by . Multiple Regression Using SPSSSPSS Output -Residuals Normality AssumptionMultiple Regression Using SPSSSPSS Output -Residuals Normality AssumptionMultiple Regression Using SPSSSPSS Output Homoscedasticity AssumptionMultiple Regression Using SPSSAPA Format Write-upA Multiple linear Regression was fitted to explain exam score based on hours spent revising, anxiety score, and A-Level entry points.
6 All of the assumptions were met except the autocorrelation assumption between residuals. The overall model explains variation of exam score, and it is significantly useful in explaining exam score, (3, 16) = , < . one-unit increase in hours, the exam score increases by .55, which was found to be a significant change, (16)= , < .05. With one-unit increase in anxiety, the exam score increases by .10, which was not found to be a significant change, (16)= , = .09. With one-unit increase in A-level, the exam score increases by . , which was found to be a significant change, (16)= , <.
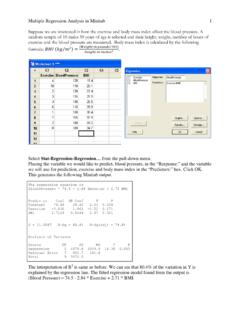
7 Regression Using SPSSP erforming the Analysis With SPSSE xample:-We want to determine whether hours spent revising, anxiety scores, and A-level entry points have effect on exam scores for if we are interested in knowing the best predictors to include in our model? Multiple Regression Using SPSSP erforming the Analysis With SPSSV ariable Selection Method Forward. Backward. Regression Using SPSSP erforming the Analysis With SPSSA nalyze > Regression > Linear > Move score to Dependent, all other variables to Independent(s) > Click on Method > Change Enter to StepwiseMultiple Regression Using SPSSSPSS OutputMultiple Regression Using SPSSP erforming the Analysis With SPSSE xercise:-We want to determine whether GRE verbal and quantitative have effect on :Please download it from here: Retrieved from this website.
8 Regression Using SPSSP resented by Nasser Hasan -Statistical Supporting Unit6/3/2020 Thanks for Listening and Attending!Any Questions?Can you please give us a minute to fill this survey as it will helpus to evaluate our performance and take your feedback intoconsideration for future webinars.