Transcription of Linear Regression Problems - University of Florida
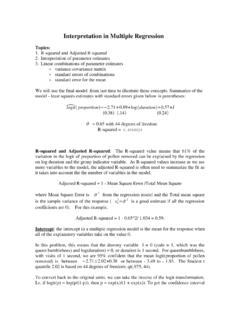
1 Linear Regression Problems A simple Linear Regression model is fit, relating plant growth over 1 year (y) to amount of fertilizer provided (x). Twenty five plants are selected, 5 each assigned to each of the fertilizer levels (12, 15, 18, 21, 24). The results of the model fit are given below: Can we conclude that there is an association between fertilizer and plant growth at the significance level? Why (be very specific). Give the estimated mean growth among plants receiving 20 units of fertilizer. The estimated standard error of the estimated mean at 20 units is )1820( Give a 95% CI for the mean at 20 units of fertilizer.
2 A multiple Regression model is fit, relating salary (Y) to the following predictor variables: experience (X1, in years), accounts in charge of (X2) and gender (X3=1 if female, 0 if male). The following ANOVA table and output gives the results for fitting the model. Conduct all tests at the significance level: Y = 0 + 1X1 + 2X2 + 3X3 + ANOVA df SS MS F P-value Regression 3 .0000 Residual 21 Total 24 Coefficients Standard Error t Stat P-value Intercept experience accounts gender Test whether salary is associated with any of the predictor variables: H0: HA: Not all i = 0 (i=1,2,3) Test Statistic _____ Reject H0 if the test statistic falls in the range(s) _____P-value _____ Coefficients a.
3 000 .527 .098 .000 (Constant) x Model 1 B Std. Error Unstandardized Coefficients t Sig. Dependent Variable: y a. Set-up the predicted value (all numbers, no symbols) for a male employee with 4 years of experience and 2 accounts. The following tables give the results for the full model, as well as a reduced model, containing only experience. Test H0: 2 = 3 = 0 vs HA: 2 and/or 3 0 Complete Model: Y = 0 + 1X1 + 2X2 + 3X3 + ANOVA df SS MS F P-value Regression 3 .0000 Residual 21 Total 24 Reduced Model: Y = 0 + 1X1 + df SS MS F P-value Regression 1 Residual 23 Total 24 Test Statistic: Rejection Region: Conclude (Circle one): Reject H0 Fail to Reject H0 A study is conducted to determine whether students first year GPA (Y) can be predicted by their ACT score (X).
4 A random sample of n=120 freshmen from a small college were selected. The following EXCEL output gives the results of a simple Linear Regression on the data. Regression Statistics multiple R R Square Adjusted R Square Standard Error Observations 120 ANOVA df SS MS F Significance F Regression 1 Residual 118 Total 119 Coefficients Standard Error t Stat P-value Lower 95% Upper 95% Intercept ACT(X) Give the fitted equation for predicting GPA as function of ACT score, and prediction for student scoring 20 on the ACT.
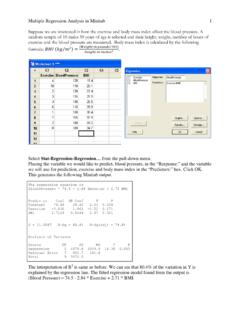
5 Test whether there is an association (positive or negative) between GPA and ACT o Null Hypothesis: Alternative Hypothesis: o Test Statistic: o P-value What proportion of the variation in GPA is explained by ACT scores? A commercial real estate company is interested in the relationship between properties rental prices (Y), and the following predictors: building age, expenses/taxes, vacancy rates, and square footage. The results for a Regression are given below. Regression Statistics multiple R R Square Standard Error Observations 81 ANOVA df SS MS F P-value Regression 4 Residual 76 Total 80 Coefficients Standard Error t Stat P-value Lower 95% Upper 95% Intercept age exp/tax vacancy sqfoot Can the company conclude that rental rate is associated with any of these predictors?
6 Give the test statistic and P-value for testing: H0: Average rental rate is not associated with any of the 4 predictors HA: Average rental rate is associated with at least one of the 4 predictors What proportion of variation in prices is explained by the 4 predictors? Controlling for all other factors, we conclude age is Positively / Negatively / Not associated with rental price. (Circle One) A study was conducted to relate weight gain in chickens (Y) to the amount of the amino acid lysine ingested by the chicken (X). A simple Linear Regression is fit to the data. Errort (X) Give the fitted equation, and the predicted value for X= Give a 95% Confidence Interval for the MEAN weight gain of all chickens with X= (Note: the mean of X is and SXX= ) What proportion of the variation in weight gain is explained by lysine intake?
7 A researcher reports that the correlation between length (inches) and weight (pounds) of a sample of 16 male adults of a species is r= Test whether she can conclude there is a POSITIVE correlation in the population of all adult males of this species: H0: = 0 HA: > 0 o Test Statistic: o Rejection Region ( = ): o Conclude: Positive Association or No Positive Association A colleague from Europe transforms the data from length in inches to centimeters (1 inch= cm) and weight from pounds to kilograms (1 pound= kg). What is the colleague s estimate of the correlation?
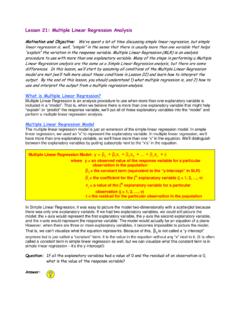
8 Late at night you find the following SPSS output in your department s computer lab. The data represent numbers of emigrants from Japanese regions, as well as a set of predictor variables from each region. Model Summary Model R R Square Adjusted R Square Std. Error of the Estimate 1 .525(a) .275 .222 a Predictors: (Constant), PIONEERS, LANDCULT, AREAFARM ANOVA(b) Model Sum of Squares df Mean Square F Sig. 1 Regression 3 .004(a) Residual 41 Total 44 a Predictors: (Constant), PIONEERS, LANDCULT, AREAFARM b Dependent Variable: EMGRANTS Coefficients(a) Model Unstandardized Coefficients Standardized Coefficients t Sig.
9 B Std. Error Beta 1 (Constant) .079 LANDCULT .639 AREAFARM .050 PIONEERS .391 .006 a Dependent Variable: EMGRANTS a) How many regions are there in the analysis? _____ b) Give the test statistic and P-value for testing (H0) that none of the predictors are associated with EMGRANTS_____ c) Give the test statistic and P-value for testing whether LANDCULT is associated with EMGRANTS, after controlling for AREAFARM and PIONEERS_____ d) What proportion of the variation in EMGRANTS is explained by the model? _____ e) Give the estimated Regression equation _____ A realtor is interested in the determinants of home selling prices in his territory.
10 He takes a random sample of 24 homes that have sold in this area during the past 18 months, observing: selling PRICE (Y), AREA (X1), BEDrooms (X2), BATH rooms (X3), POOL dummy (X4=1 if Yes, 0 if No), and AGE (X5). He fits the following models (predictor variables to be included in model are given for each model): Model 1: AREA, BED, BATH, POOL, AGE SSE1 = 250, SSR1 = 450 Model 2: AREA, BATH, POOL SSE2 = 325, SSR2 = 375 a) Test whether neither BED or AGE are associated with PRICE, after adjusting for AREA, BATH, and POOL at the = significance level.