Transcription of Multiresidue Analysis of 100 Pesticides in Food …
1 AuthorsImma Ferrer and E. Michael ThurmanPesticide Residue Research GroupUniversity of AlmeriaAlmeria, SpainYanyan Fang, Paul Zavitsanos, and Jerry A. ZweigenbaumAgilent Technologies, An analytical methodology for confirming the presence ofa group of 100 Pesticides in vegetable and fruit sampleswas developed using the Agilent G6410AA Triple Quadru-pole Mass Spectrometer (QQQ). One transition per parentcompound was monitored in a single chromatographicrun containing two time segments. The sensitivityobtained meets the maximum residue levels (MRLs)established by the European Union regulation for foodmonitoring programs. The analytical performance of themethod was evaluated for different types of fruit and veg-etables +orange, tomato, and green pepper +showinglittle or no matrix effects.
2 Linearity of response over twoorders of magnitude was demonstrated (r > ). Thisstudy is a valuable indicator of the potential of the QQQfor routine quantitative Multiresidue Analysis of pesticidesin vegetables and Analysis of 100 Pesticides inFood Samples by LC/Triple QuadrupoleMass SpectrometryApplication IntroductionIn recent years, the established regulations regarding the maximum residue limits (MRLs) incommodities have become more and more strin-gent. The European Union (EU) has set new direc-tives for Pesticides at low levels in vegetables inorder to meet health concerns. For fruits and veg-etables intended for production of baby food, anMRL of 10 g/kg is applicable for all Pesticides ,and compounds without a stated regulation alsohave the lowest MRLs at 10 g/kg.
3 The low MRLshave encouraged the development of more sensi-tive analytical methods to meet the requirementsin complex samples. In this sense, liquid-chromatography tandem-mass spectrometry (LC-MS-MS) with triple quadrupole in multiplereaction monitoring (MRM) mode has become, sofar, the most widely used technique for the moni-toring and quantitation of Pesticides in food, asreported extensively in the literature. On the otherhand, high-resolving power mass spectrometrictechniques, such as time-of-flight mass spectrome-try (TOF-MS), have been applied recently forscreening purposes as well. Nevertheless, the sim-plicity of methodologies using triple quadrupole asa detection technique, together with the low limitsof detection achieved and the MS/MS capabilitymake this technique a valuable tool for routineFood Safety2monitoring programs established in regulatoryofficial laboratories.
4 The easiness of use is some-times an essential for these types of regulatoryagencies, which lack the high-skilled personnelrequired for more sophisticated techniques such asTOF-MS. Triple quadrupole technology is not newin the sense that it needs to be validated for moni-toring purposes and its basis is already well-established for routine study in this report is one of the first of itskind to examine the new Agilent Triple Quad forthe Analysis of Pesticides in fruit and topic was chosen because of the relevance ofthese compounds and their significant use on foodcommodities. The sensitivity of the QQQ easilymeets the levels required by the regulations onpesticides in preparationPesticide analytical standards were purchasedfrom Dr.
5 Ehrenstorfer (Ausburg, Germany). Individual pesticide stock solutions (around 1,000 g/mL) were prepared in pure acetonitrile ormethanol, depending on the solubility of each indi-vidual compound, and stored at 18 C. Fromthese mother solutions, working standard solu-tions were prepared by dilution with acetonitrileand samples were obtained from the localmarkets. Blank vegetable and fruit extracts wereused to prepare the matrix-matched standards forvalidation purposes. In this way, two types of veg-etables and one fruit (green peppers, tomatoes,and oranges) were extracted using the QuEChERSmethod already described in a previous applica-tion [1]. The vegetable extracts were spiked withthe mix of standards at different concentrations(ranging from 2 to 100 g/kg) and subsequentlyanalyzed by LC/ InstrumentationLC ConditionsColumn:Agilent ZORBAX Eclipse XDB C-8, mm 150 mm, 5 m, (p/n 993967-906).
6 Column temperature:25 CMobile phase:A = formic acid in water B= AcetonitrileFlow- mL/minGradient:10% B at 0 min10% B at 5 min100% B at 30 minInjection volumes:1-5 LMS ConditionsMode:Positive ESI using the Agilent G6410 AATriple Quadrupole Mass SpectrometerNebulizer:40 psigDrying gas flow:9 L/minV capillary:4000 VDrying gas temperature: 350 CQ1 resolution:UnitQ2 resolution:UnitFragmentor voltage:70 VCollision energy:5 25 VMRM:1 transition for every compound asshown in Table 1 Dwell time:15 msecResults and DiscussionOptimization of LC/MS/MS conditionsA preliminary study of the optimal MRM transi-tions for every compound was carried out byinjecting groups of analytes (around 10 analytes inone chromatographic run) at a concentration levelof 10 g/mL.
7 Various collision energies (5, 10, 15,20, and 25 V) were applied to the compoundsunder study. The optimum energies were thosethat gave the best sensitivity for the main fragmention and, as a general rule, left about 10% of parentcompound in the spectra, and they were selectedas optimum ones. Only one fragment ion waschosen as the most abundant product ion for everytarget compound. Results are shown in Table Protonated Product ion Collision LOD Compound nametime (min)molecule [M+H]+(m/z)energy(pg) Segment 2 Spinosad Conditions and Limits of Detection (LOD) for Each of the Compounds isomer isomer isomer isomer isomer isomer isomer isomer Protonated Product ion Collision LOD Compound nametime (min)molecule [M+H]+(m/z)energy(pg)
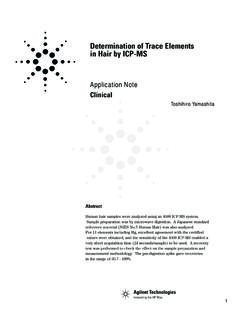
8 Table Conditions and Limits of Detection (LOD) for Each of the Compounds Tested (Continued)5 The MRM transitions were included in the methodwith a dwell time of 15 msec, and two differenttime segments were recorded in the chromato-graphic run (each one of them containing abouthalf of the Pesticides studied). Figure 1 shows thechromatogram corresponding to 100 pg on columnfor all the compounds studied. Extracted ion chro-matograms are overlaid for each one of the targetanalytes according to their respective protonatedmolecule and product ion MRM and Limits of DetectionLinearity was evaluated by analyzing the stan-dards solutions at five different concentrationlevels in the range 2 to 100 pg on column. As vs. acquisition time (min)12345678910111213141516171819202122 2324252627282930313233+ MRM ( ) mix100_100 1122 Figure ion chromatograms of a mix of 100 Pesticides (concentration: 100 pg on column).
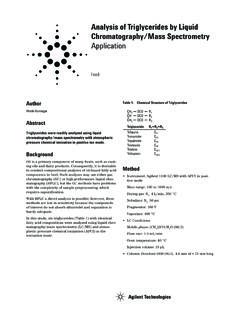
9 Example, the calibration curve generated foratrazine is shown in Figure 2. As it can beobserved in this figure, the linearity of the analyti-cal response across the studied range is excellent,with a correlation coefficient of Similarresults were obtained for the rest of the compounds limits of detection (LOD) were estimated fromthe injection of standard solutions at concentra-tion levels corresponding to a signal-to-noise ratioof about 3. The results obtained are included inTable 1 as well. The best limits of detection wereobtained for the triazines (from 100 fg to 2 pg oncolumn) and the highest limits of detection werefor fluoroxypyr and spinosad D (above 100 pg).y = = injected (pg)Area% Figure curve for atrazine using a linear fit with no weighting and noorigin shall not be liable for errors contained herein or for incidental or consequentialdamages in connection with the furnishing, performance, or use of this , descriptions, and specifications in this publication are subject to changewithout notice.
10 Agilent Technologies, Inc. 2006 Printed in the USAA ugust 9, to Vegetable MatricesTo confirm the suitability of the method for analy-sis of real samples, matrix-matched standardswere analyzed in three different matrices +greenpepper, tomato, and orange +at two different con-centration levels (10 and 100 g/kg). Figure 3shows the Analysis of a green pepper spiked withthe pesticide mix at 10 g/kg (10 pg on column).As it can be observed in two of the MS/MSextracted product ion chromatograms, fordimethoate and azoxystrobin, compounds can beeasily identified in these complex matrices due tothe selectivity of the MRM transitions, thus fulfill-ing the regulation limits imposed by the EU direc-tives. In general, the LOD obtained meet therequirements regarding the MRLs imposed by theexisting European Imma Ferrer and E.