Transcription of Murray International Trust Plc MYI - funddata.com
1 Page 1 of 2 | Morningstar Factsheets | All data as at 30 Aug 2018 unless stated otherwise Murray International Trust Plc MYI The factbook pages are compiled by Morningstar and have no regard to the particular needs of any specific recipient. All price information is indicative only. Nothing herein is to be construed as a solicitation or an offer to buy or sell any financial products. The factbook pages are prepared by Morningstar and based on information obtained from sources believed to be reliable but are not guaranteed as being accurate, nor are they a complete statement of these securities. Morningstar accepts no liability whatsoever for any loss or damage of any kind arising out of the use of all or part of these factbook pages.
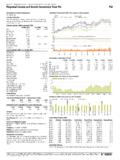
2 Morningstar Peer Group Classification Global Equity Income Investment Objective To achieve a total return greater than its benchmark by investing predominantly in equities worldwide. Valuation statistics (NAVs estimated1) GBX 30 Aug 201812 m High Low Price 1, 1, 1, Fair Cum NAV 1, Fair Ex NAV 1, Par Cum NAV 1, Par Ex NAV 1, 1, 1, Fair Cum Discount Fair Ex Discount + Par Cum Discount Par Ex Discount + Peer Group Discount Z-Statistic2 Last Actual NAVs (GBX) as at 29 Aug 2018 Fair Cum NAV Fair Ex NAV Par Cum NAV Par Ex NAV Key Data Domicile UK Launch Date 18 Dec 1907 Financial Year-end 31 Dec Exchange London (LSE)
3 Next AGM Apr 2019 NAV Frequency Daily Dividend Frequency Quarterly Total Assets (GBP) 1, Net Assets (GBP) 1, Shares Outstanding 128,143,545 Gross Gearing3 113 Net Gearing4 113 Average Daily Shares Traded (1yr) Average Daily Value Traded (1yr)
4 Total Expense Ratio5 (2017) Market Capitalisation (GBP) 1, Net Dividend Yield6 Dividend Policy The fund intends to pay quarterly dividends Year-on-Year Dividend Growth % (financial year 31 Dec) Growth % (annualised on current financial year)7 1 year2 years3 years4 years5 Kevin Carter (Chairman), Claire Binyon, Marcia Campbell, Peter Dunscombe, David Hardie, Alexandra Mackesy Fund Manager: Bruce Stout (16 Jun 2004) Aberdeen Asset Management 40 Princes Street, Edinburgh, UK, EH2 2BY Telephone: +44 (0)131 528 4000 Website: Stockbroker: Stifel Nicolaus Europe Limited Management Fee Summary Management fee will be charged at of Net Assets up to GBP 1,200 m, of Net Assets between GBP 1,200 m and GBP 1,400 m, and of Net Assets above GBP 1,400 m.
5 Contract terminable on six months notice. Total Return Performance (GBP) over 5 years (or since inception) Performance (Total Return %)8 GBP 1 month3 months6 months1 yearYTD3 years5 yearsPrice + + + + + Group (Price) + + + Group (NAV) + + + + + + + + + + + + + Group: Morningstar IT Global Equity Income P Morningstar Benchmark: FTSE World Index World Fund distributions reinvested on ex-dividend date8 Dividend Yields over 5 years (or since inception) Distributions (GBP) over 5 years (or since inception) Latest Dividend History (GBp)
6 Type DividendDeclared DateEx Div DateRecord DatePayment DateFinancial YearIncome Income Income Income Income Income Income Income Income Income Income Income Aug 18 26 Apr 18 09 Mar 18 29 Nov 17 10 Aug 17 25 Apr 17 13 Mar 17 30 Nov 16 11 Aug 16 26 Apr 16 14 Mar 16 02 Dec 1504 Oct 18 05 Jul 18 05 Apr 18 04 Jan 18 05 Oct 17 06 Jul 17 06 Apr 17 05 Jan 17 06 Oct 16 07 Jul 16 07 Apr 16 07 Jan 1605 Oct 18 06 Jul 18 06 Apr 18 05 Jan 18 06 Oct 17 07 Jul 17 07 Apr 17 06 Jan 17 07 Oct 16 08 Jul 16 08 Apr 16 08 Jan 1619 Nov 18 17 Aug 18 18 May 18 19 Feb 18 17 Nov 17 17 Aug 17 16 May 17 17 Feb 17 17 Nov 16 17 Aug 16 18 May 16 18 Feb 162018 2018 2017 2017 2017 2017 2016 2016 2016 2016 2015 2015 Initial Public Offering on 18 Dec 1907 Page 2 of 2 | Morningstar Factsheets | All data as at 30 Aug 2018 unless stated otherwise Murray International Trust Plc MYI 1 NAV Estimation - Fair value of debt refers to the market price of the debt if it is traded or, if it is not traded, an estimation of its value calculated using points over gilt methodology.
7 Cum Income NAVs include net revenue in the financial year to date. All estimates are fully diluted for the effects of warrants, convertibles or treasury shares. NAV estimations are created and maintained by Morningstar. For more detailed methodology document please contact 2 Z-Statistic 1y Shows whether the fund s current discount is significantly higher or lower than the average over the past year, calculated as (Current Discount Mean) / Std Dev 3 Gross Gearing The ratio of estimated gross Assets to the Net Assets, expressed as a percentage 4 Net Gearing The ratio of estimated Gross Assets minus cash and fixed interest to the Net Assets, expressed as a percentage.
8 Cash and fixed interest represents not-equity exposure. 5 Total Expense Ratio (Total Expenses Performance Fees Cost of Leverage Tax Restructuring Costs) / Average Net Assets 6 Net Dividend Yield This is calculated by dividing the current financial years dividends (this will include prospective dividends) by the current price. 7 Dividend Growth The annualised percentage growth in dividends. Based upon the current financial year, including any future estimates or forecasts. 8 Performance Calculated using start and end period Share Prices or NAV Dividends are reinvested on the ex-dividend date at the prevailing Share Price or NAV.
9 9 Risk & Return 1 Year ex income par NAV total return performance against 1 Year NAV volatility. Please see notes 8 and 15 for performance and volatility definitions respectively. 10 Portfolio In order to calculate the portfolio value we deduct any holdings in cash only (Note that Fixed Interest is not included). 11 Alpha The difference between the fund s average excess total return and the benchmark s average excess total return. 12 Beta The sensitivity of the fund to broad market movements. A Beta of would imply the fund will move by half as much as the index. 13 R-squared A measure of correlation between the fund and index.
10 A value of means that 80% of the fund s NAV changes can be explained by changes in the index. 14 Sharpe A risk-adjusted return measure, calculated by dividing the fund s average monthly excess total return over the risk-free rate by the standard deviation of those returns. The figure shown is the annualized Sharpe Ratio. 15 Volatility The annualized standard deviation of the logged daily returns, adjusting for distributions from capital. The factbook pages are compiled by Morningstar and have no regard to the particular needs of any specific recipient. All price information is indicative only. Nothing herein is to be construed as a solicitation or an offer to buy or sell any financial products.