Transcription of NAGALAND DATA HIGHLIGHTS : THE SCHEDULED TRIBES …
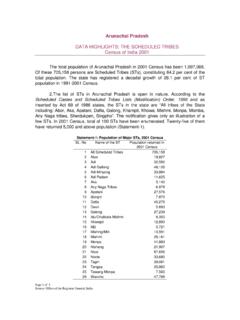
1 Page 1 of 4 Source: Office of the Registrar General, India NAGALAND data HIGHLIGHTS : THE SCHEDULED TRIBES census of India 2001 The population of NAGALAND in 2001 census has been 1,990,036. Of these, 1,774,026 are SCHEDULED TRIBES (STs) constituting per cent of the total population of the state. The State has registered decadal growth of per cent in ST population in 1991-2001. NAGALAND has five communities notified as STs. These are Garo, Kachari, Kuki, Mikir, and Naga. 2. Naga is a generic name for several groups, each having distinct identity.
2 In 1971 census , figures of sixteen Naga sub- TRIBES were given separately for the first time. They were: (i) Angami, (ii) Ao, (iii) Chakhesang, (iv) Chang, (v) Chirr, (vi) Khiemnungan, (vii) Konyak, (viii) Lotha, (ix) Makware, (x) Phom, (xi) Rengma, (xii) Sangtam, (xiii) Sema, (xiv) Tikhir, (xv) Yimchungre, and (xvi) Zeliang. Subsequently, in 1991 census , Pochury Naga was added and their number shown separately. In 2001 census , no population of Makware has been returned. Instead, sizeable population has returned either as Naga or as sub- TRIBES other than the seventeen Naga sub- TRIBES hitherto published in census .
3 These have been thus separately grouped under Naga and Unclassified Nagas respectively. Total Naga population in the state thus includes population of all Naga sub- TRIBES as well as Naga and Unclassified Nagas (Statement-1). Statement-1: Total Naga Population & Population of different Naga sub- TRIBES and their Proportion to Total Naga Population, 2001 census Name of the tribe/ sub-tribe Population Proportion to total Naga population Total Naga (Naga etc.) 1741692 100% 1 Angami 124696 2 Ao 231823 3 Chakhesang 134646 4 Chang 60885 5 Chirr 19 N 6 Khiemnungan 38137 7 Konyak 243758 8 Lotha 148210 9 Phom 115389 10 Pochury 15908 11 Rengma 50966 12 Sangtam 83714 13 Sema 241806 14 Tikhir 10377 15 Yimchungre 75983 16 Zeliang 71871 17 Naga* 79273 18 Unclassified Naga 14231 * Those who wrote their tribe name Naga.
4 N = Negligible Page 2 of 4 Source: Office of the Registrar General, India Population: Size and Distribution 3. Of the five communities notified as STs in NAGALAND , the Naga constitutes per cent. Sema, Konyak, Ao, Lotha, Chakhesang, Angami, Phom, etc. are major Naga sub- TRIBES , each having more than one lakh population as per 2001 census . Kuki is the second largest ST having only per cent of the state s total ST population. Kachari and Garo account for less than one per cent. Mikir is the smallest among STs in the state; only 106 persons of Mikir have been returned at 2001 census .
5 Statement-2: SCHEDULED Tribe Population, 2001 census Name of the SCHEDULED Tribe Total population Proportion to the total ST population All SCHEDULED TRIBES 1,774,026 100% Naga etc. 1,741,692 Kuki 20,195 Kachari 7,807 Garo 1,582 Mikir 106 N N= Negligible 4. Majority of the ST population (87%) lives in rural areas. Of the seventeen Naga sub- TRIBES , Lotha, Ao, Angami, and Chang, each have more than 16 per cent urban residents. On the other hand, Tikhir, Phom, Pochury, and Zeliang are having less than 5 per cent urban population.
6 Lotha is the most urbanized tribe with per cent urban population, while Tikhir is the least urbanized ( ). Sex Ratio 5. As per 2001 census , sex ratio of total ST population is 943. Among the Naga sub- TRIBES , females outnumbered males in Angami (1004). Besides, nine (9) other TRIBES have sex ratio above 950. Among the sub-groups of Naga having more than one lakh population in 2001, Phom has recorded low sex ratio of 891. 6. Child sex ratio (0-6 age group) of tribal population of the state is 969 and 18 TRIBES including Naga sub- TRIBES have recorded 950 or above child sex ratio.
7 Tikhir has recorded very low child sex ratio of 831. Literacy and Educational level 7. As per 2001 census , 66 per cent of the total ST population is literate, with male and female literacy at and per cent respectively. The percentage of literates among Naga is per cent. Wide disparity is discerned among the seventeen Naga sub- TRIBES . For example, Ao is at the top with literacy rate of per cent, while Konyak is at the bottom with literacy rate of per cent. Page 3 of 4 Source: Office of the Registrar General, India 8.
8 Among the ST literates, per cent are either without educational level or have below primary level education. Primary level of literates account for 28 per cent while 15 per cent have attained Matric/ Secondary level education. 9. per cent of the ST population in the age group 5-14 has been attending educational institutes in 2001 census . Four TRIBES namely Kachari, Naga etc., Angami, and Lotha have recorded more than 80 per cent children (5-14) attending school/ educational institutions in 2001. Work Participation Rate (WPR) 10.
9 Among the STs, per cent of the population has been recorded as workers. Gender-wise, the female WPR at per cent is a little lower than male ( ). There is no noticeable disparity among the different STs with regard to WPR. Statement-3: Distribution of Total, Main & Marginal Workers among the STs Percentage of Workers T/M/F Total Workers Main Workers Marginal Workers Total 751,285 ( ) 617,884 ( ) 133,401 ( ) Male 406,247 ( ) 348,400 ( ) 57,847 ( ) Female 345,038 ( ) 269,484 ( ) 75,554 ( ) 11. Of the total workers among the STs, per cent have been reported as main workers and per cent as marginal workers.
10 The percentage of female main workers at per cent is slightly lower than male ( ). This speaks for almost equitable male-female participation in economic pursuits. Category of Workers 12. Among main workers, an overwhelming per cent of the ST population has been recorded as cultivator. A significant percentage of main workers ( ) are engaged in manufacturing and repairs work. Marital Status and Fertility 13. The distribution of ST population by marital status shows that per cent is never married, per cent currently married, per cent widowed, and per cent divorced & separated.